Figure 4.
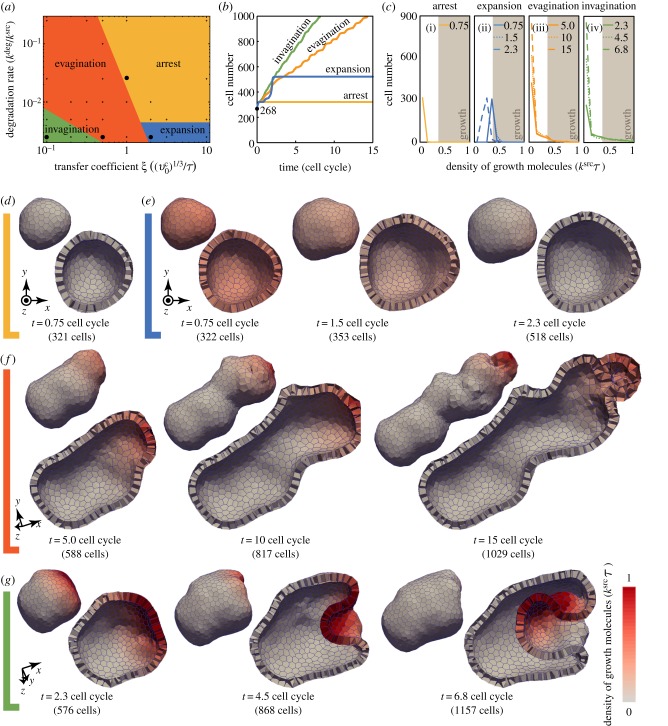
Computational simulations of signal-dependent epithelial growth. (a) Phase diagram of the tissue morphogenesis. Morphogenesis is categorized into four phases: arrest (yellow), expansion (blue), evagination (orange) and invagination (green). (b) The number of cells composing a tissue as a function of time. Plotted colours indicate the four phases of morphogenesis marked by points in the phase diagram shown in (a): arrest (yellow), expansion (blue), evagination (orange) and invagination (green). (c) Histograms of molecular density for the four phases. Cells are sorted by their molecular densities with respect to the range of  . Brown areas indicate those of cell growth, where the density of growth molecules is higher than the threshold ρth. Individual lines in each histogram correspond to time steps shown in (d–g), respectively. (d–g) Time series images of the growing epithelial vesicles in the four phases, respectively. Colours indicate the density of the growth molecules within individual cells. In (d–g), the clip view of tissues is shown 1.5 times as large as the whole view. The deformation processes in the phases of expansion, evagination and invagination are also shown in the electronic supplementary material, movies 1, 2 and 3, respectively. (Online version in colour.)

