Abstract
Rapid prototyping techniques have been widely used in tissue engineering to fabricate scaffolds with controlled architecture. Despite the ability of these techniques to fabricate regular structures, the consistency with which these regular structures are produced throughout the scaffold and from one scaffold to another needs to be quantified. Small variations at the pore level can affect the local mechanical stimuli sensed by the cells thereby affecting the final tissue properties. Most studies assume rapid prototyping scaffolds as regular structures without quantifying the local mechanical stimuli at the cell level. In this study, a computational method using a micro-computed tomography-based scaffold geometry was developed to characterize the mechanical stimuli within a real scaffold at the pore level. Five samples from a commercial polycaprolactone scaffold were analysed and computational fluid dynamics analyses were created to compare local velocity and shear stress values at the same scaffold location. The five samples did not replicate the computer-aided design (CAD) scaffold and velocity and shear stress values were up to five times higher than the ones calculated in the CAD scaffold. In addition high variability among samples was found: at the same location velocity and shear stress values could be up to two times higher from sample to sample. This study shows that regular scaffolds need to be thoroughly analysed in order to quantify real cell mechanical stimuli so inspection methods should be included as part of the fabrication process.
Keywords: tissue engineering, polycaprolactone scaffold, computational fluid dynamics, rapid prototyping, wall shear stress, fluid velocity
1. Introduction
Scaffolds aim to provide a template that serves as a host to guide cells to produce their extracellular matrix. Adequate pore size, regular porosity and interconnectivity are required to allow tissue ingrowth, neovascularization, mass transport and suitable mechanical properties [1,2]. In addition, scaffolds must be biocompatible, and should ideally degrade at specific rates while new tissue is growing and stimulate cell response [3].
Rapid prototyping techniques can be used in a wide range of scaffold biomaterials such as poly(glycolic acid) [4], poly(lactic acid) [5], polycaprolactone (PCL) [6] and polyethylene glycol [7]. A pre-defined regular computer-aided design (CAD) geometry is defined to produce the scaffold in a layer by layer manner [8]. These techniques can be classified regarding the way the material is deposited: laser-based such as stereolithography and laser sintering with accuracies of 0.5–20 µm and 50 µm, respectively, printing-based such as three-dimensional printing and wax printing with accuracies of 50 µm, and melting-extrusion methods with accuracies of about 100 µm [9,10]. Despite the great potential of these fabrication methods to build scaffolds with highly accurate controlled architecture, they still have to develop towards Good Manufacturing Practice (GMP) standards to ensure scaffold commercial production and successful translation into clinics [11]. Scaffold fabrication is expected to replicate the design geometry, deliver the required mechanical properties and provide repeatability in batch production. Some efforts have been made to meet these requirements as shown in the study of Van Bael et al. [12], who optimized the fabrication method through a feedback loop approach where the fabricated samples were morphologically and mechanically characterized to adapt the fabrication parameters until the desired results were reached. Domingos et al. [13] showed that the high sensitivity of the fused deposition modelling process parameters to extrusion speed and temperature alters the final PCL scaffold geometry. Garrett et al. [14] highlighted the need of inspecting fabricated scaffolds to predict potential failure modes of the scaffold in its intended application due to limitations of the fabrication process. They characterized a regular three-dimensional printed titanium scaffold using micro-computed tomography (µCT) reporting significant variability with respect to the CAD model in terms of geometry and response during fatigue analysis. Podshivalov et al. [15] argued the steps involved from scaffold design up to its human body implantation should be standardized with the inclusion of scaffold inspection. Scaffold inspection should be carried out to assess variability of geometry and performance as it could strongly affect cell response and therefore tissue outcomes. As it is unknown what range of scaffold variability would be detrimental for the development of newly formed tissue, herein it is argued that scaffolds have to be analysed in a more systematic way to better predict experimental results. Previous studies have inspected fabricated scaffold geometry by scanning electron microscopy observations and measurements [16]. However, despite their high accuracy they are restrained to two-dimensional information in a limited field of view. µCT scanning allows the characterization of the full scaffold structure as shown by Wang et al. [17]. Furthermore, by the inclusion of the µCT-based reconstruction of the scaffold in finite-element and computational fluid dynamics (CFD) simulations, it is possible to link scaffold performance variability to its geometry [18–22]. However, most of these studies provide average values thereby missing information about the local effect of the geometry on the mechanical microenvironment.
The goal of this study was to inspect the geometry of a commercial regular scaffold and relate scaffold geometry variability to its fluid dynamic microenvironment under perfusion conditions. In this study, the wall shear stress (WSS) and fluid velocities within five fabricated scaffolds based on the same design were calculated by CFD. The objective was to compare the performance of the five samples, which in principle should be the same, and reproduce the CAD design outcomes. As a novelty, the method presented enables the assessment of intersample variability by comparing sample velocities and WSS values at the same location within the pore level.
2. Material and methods
2.1. Scaffold design and fabrication method
PCL scaffolds from 3D Biotek (New Jersey, USA) were used. The original CAD design consists of a regular internal distribution of fibres with a diameter and spacing between fibres of 300 µm (figure 1a). The diameter and height of the scaffold are 5 mm and 1.5 mm, respectively. There are six layers of fibres with an offset of 90° in the orientation of the fibres from layer to layer (figure 1a). Also, between consecutive layers the fibres are displaced by 300 µm.
Figure 1.
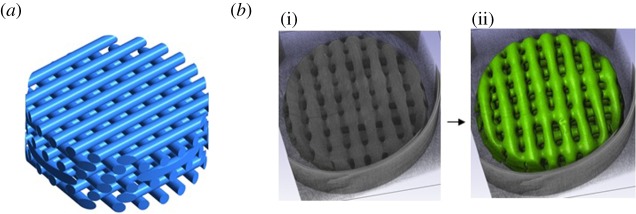
(a) CAD geometry of the 3D Biotek PCL scaffold. (b) Fabricated sample scanned using μCT (i) and segmented volume (ii). (Online version in colour.)
2.2. Micro-computed tomography and reconstruction
Five samples were scanned using µCT scan (Skyscan1172, Materialise, Belgium) at 59 kV voltage and 149 µA beam current with a voxel size of 7 × 7 × 7 µm3. A sensitivity analysis was carried out with voxel sizes of 16, 8 and 4 µm3 prior to scanning to select the voxel size that provides enough resolution without compromising the size of the data. The µCT image data were reconstructed using Simpleware (Exeter, UK). The stack of images was processed using median filter to facilitate the segmentation process (figure 1b). The region of interest was segmented and then filtered with recursive Gaussian filter to smooth the geometry in order to facilitate the surface meshing process. The scaffolds were characterized using Simpleware statistics and ImageJ (NIH).
2.3. Mesh generation and sensitivity analysis
Scaffold surface mesh was created first using Simpleware and then exported to ICEM Ansys (Ansys, Pittsburgh, USA), where it was positioned inside a cylinder (figure 2) and both the scaffold surface and the cylinder were considered as wall boundary conditions for the fluid volume mesh. The cylinder has a radius of 2.72 mm and a length of 28 mm. This geometry was selected for the five samples and for the CAD scaffold. The 2.72 mm radius was selected due to the need to reduce the gap between the tube and the scaffolds to ensure that the fluid flow passes through the scaffold and at the same time that there is no tube–scaffold intersection to avoid meshing problems. After performing a grid independency test, an adaptive mesh with tetrahedral elements was selected with smallest element size of 20 µm close to the scaffold geometry with a total of 10 million elements (figure 2).
Figure 2.
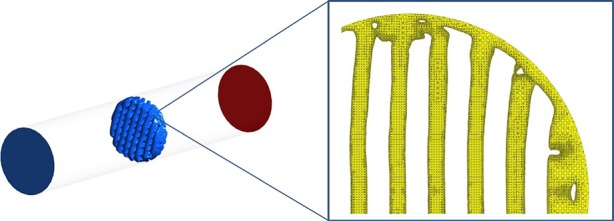
The μCT-based scaffold is located inside a cylinder using ICEM Ansys. The wall boundary conditions are the cylinder and the scaffold surface (left). The fluid volume is meshed within these wall boundaries (right). (Online version in colour.)
2.4. Computational fluid dynamics simulations
A steady laminar fluid flow was simulated using Ansys Fluent with 1 mm s−1 velocity inlet and zero pressure outlet. The fluid flow is described by the three-dimensional Navier–Stokes equation and fluid volume mesh is resolved using the finite volume method. The fluid was described as an incompressible Newtonian fluid with a viscosity of 0.001 kg m s−1 and a density of 1000 kg m−3. Non-slip wall condition was modelled.
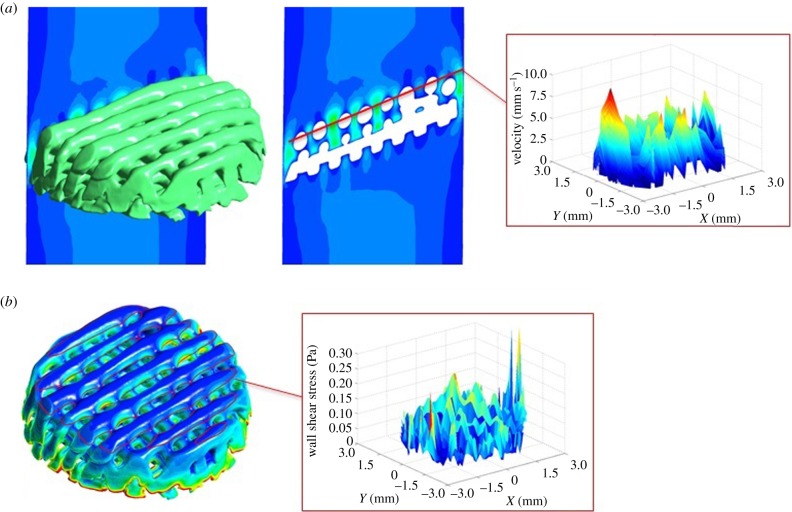
The calculated data from the CFD simulations were first analysed in CFD post Ansys, where velocity and WSS data were extracted at the pore level in all the scaffolds. The collected pore values were arranged by scaffold layers using Matlab. Once the data were organized according to scaffold locations, three-dimensional contours of velocity and WSS were plotted to characterize the fluid flow inside the scaffold and compare all the scaffolds at the same location (figure 3).
Figure 3.
(a) Fluid flow velocity analysis in CFD post Ansys. Fluid velocity data are extracted from all the pores throughout the entire scaffold. The data are organized by layers and pores using Matlab to plot three-dimensional velocity profiles of each layer. (b) Scaffold WSS analysis in CFD post Ansys. WSS data are extracted from all the scaffold fibres. The data are organized by layers and pores using Matlab to plot three-dimensional WSS profiles of each layer. (Online version in colour.)
3. Results
3.1. Structural analysis
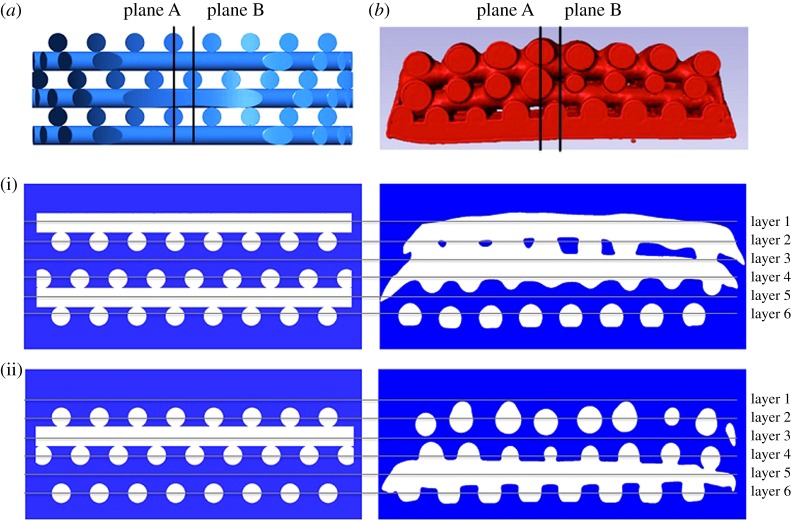
The µCT scan reconstructions show that the resulting geometry of the fabricated scaffolds does not replicate the original design. All the samples present a decreasing diameter gradient from the top layer to the bottom layer (figure 4) and defects at the edges due the punching during the fabrication process.
Figure 4.
Qualitative comparison of scaffold architecture between CAD scaffold (a) and one µCT image-based reconstructed sample (b) from cross sections in plane A (i) and plane B (ii). (Online version in colour.)
In addition, the samples have different internal microstructure pattern from the CAD pattern. A qualitative comparison between the reconstructed samples and the CAD scaffold shows that layers 2 and 4 of the µCT-based scaffolds are aligned, whereas in the CAD scaffold all alternate layers have an offset of 300 μm displacement (figure 4). This different pattern from the CAD scaffold is repeated in four of five samples. The sample that is different shows a contrary pattern. Layers 2 and 4 have an offset and layers 4 and 6 are aligned. One reason could be that the sheets of fibres were punched from the other side.
The fibre diameter varies from 220 ± 100 µm after measuring reconstructed µCT images in the open source software ImageJ. In addition, all the scaffolds were characterized using Simpleware statistics module showing 100% interconnectivity and the porosity, surface area and volume are reported in table 1.
Table 1.
Scaffold structural characterization.
| scaffolds | 1 | 2 | 3 | 4 | 5 | CAD |
|---|---|---|---|---|---|---|
| porosity (%) | 51 | 45 | 40 | 40 | 51 | 46 |
| surface area (mm2) | 193 | 193 | 207 | 213 | 226 | 190 |
| volume (mm3) | 14.6 | 16 | 17.6 | 17.6 | 14.7 | 13.7 |
3.2. Velocity profiles (computational fluid dynamics)
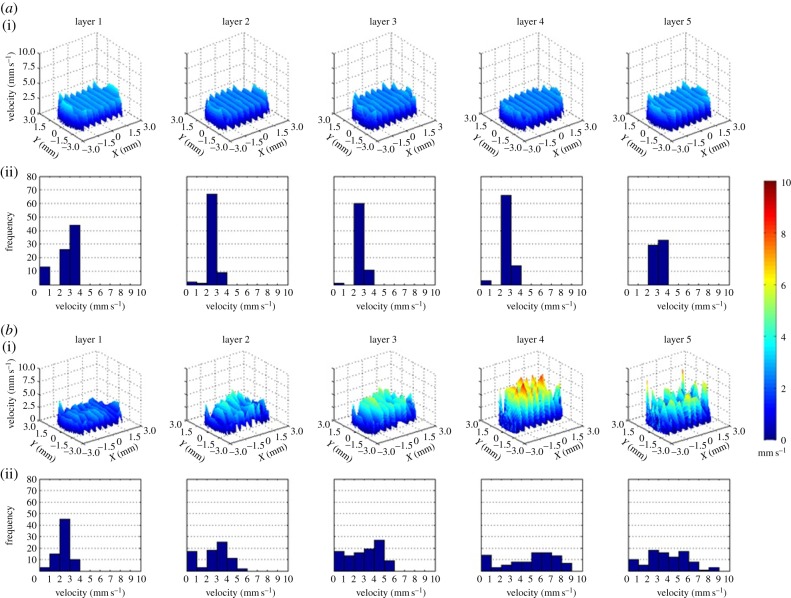
Homogeneous velocity profiles are found in all layers inside the CAD scaffold with meaningless variability from layer to layer. It can be observed that there is clear repeatability of pore velocities within 2 and 3 mm s−1. The velocity profiles of the five µCT-based scaffolds are heterogeneous with pore to pore variability from velocities close to zero up to 10 mm s−1 in the same layer. In addition, inside all samples the velocity profiles differ from layer to layer as shown in figure 5.
Figure 5.
(a) Velocity profiles of all the layers of pores of the CAD scaffold (i). Frequency diagram of the velocity values of each layer (ii). Profiles in layers 1 and 5 that correspond with the inlet and the outlet of the scaffold present similar profile with velocities found mainly within 2 and 4 mm s−1 values, whereas in the internal layers 2, 3 and 4 the most repeated pore velocities are found in a range from 2 to 3 mm s−1. (b) Velocity profiles of all the layers of pores of one of the fabricated scaffolds (i). Frequency diagram of the velocity values of each layer (ii). Layer 1 seems to agree well with the layer 1 from the CAD scaffold. However, from layer to layer in fabricated scaffold pore velocities vary from close to zero up to 9 mm s−1. The other samples also present irregular pore velocity distribution with variations up to 10 mm s−1. (Online version in colour.)
Velocity values from all the scaffolds can be compared at the same location as shown in figure 6 in order to assess variability. The velocity profiles from the CAD scaffold show higher pore velocity repeatability in a narrower range of values than the five samples that have more irregular profiles varying within a large range of velocities. In addition to the fact that the samples do not replicate CAD scaffold profiles, there is also intersample variability since the fluid flow pattern of each sample is different from the others.
Figure 6.
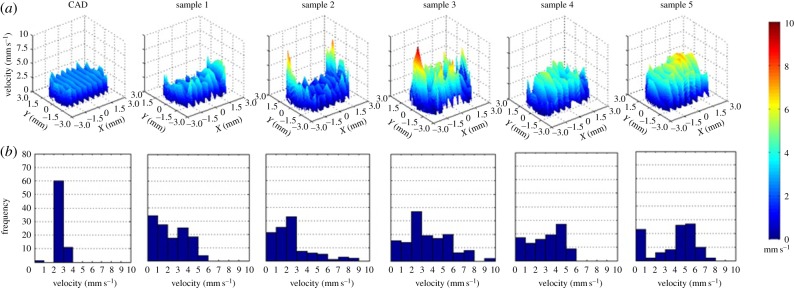
Velocity profiles of the CAD scaffold and the five samples in layer 3 (a). Frequency diagram of the velocity values of all the scaffolds at layer 3 (b). In sample 1, the range of velocities goes up to 6 mm s−1. In sample 2, low velocities are more frequent although values go up to 9 mm s−1 at the edges of the scaffold. In sample 3, pore velocity frequencies are well distributed within a 10 mm s−1 range. A similar result appears in sample 4 with velocities from close to zero up to 6 mm s−1. In sample 5, the most repeated values are between 4 and 6 mm s−1 that are found at the centre of the layer. (Online version in colour.)
3.3. Wall shear stress profiles (computational fluid dynamics)
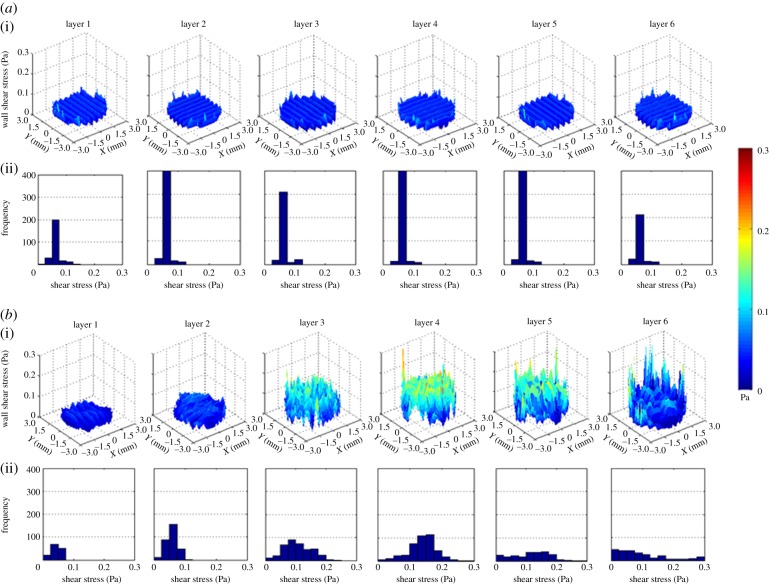
WSS profile throughout the CAD scaffold is homogeneous and constant with predominant values between 0.05 and 0.075 Pa (figure 7). On the other hand, the five samples show heterogeneous WSS profiles with stress values from close to zero up to 0.3 Pa in the same layer. Furthermore, inside all samples the WSS profile varies from layer to layer as shown in figure 7.
Figure 7.
(a) WSS profiles of all the layers of fibres of the CAD scaffold (i). Frequency diagram of the WSS values of each layer (ii). More repeated values are between 0.05 and 0.075 Pa. (b) WSS profiles of all the layers of fibres of one fabricated scaffold (i). Frequency diagram of the WSS values of each layer (ii). Layers 1 and 2 have high pore to pore repeatability with values found between 0.075 and 0.125 Pa, respectively. These two profiles are the closest ones to the CAD WSS profiles. In layers 3 and 4, more variability is observed from pore to pore with values close to zero up to 0.25 Pa and higher frequencies around 0.1 and 0.15, respectively. In the last two layers close to the outlet, there is not a high number of repetitions of WSS values resulting in very irregular profiles within a range of close to zero up to 0.3 Pa. (Online version in colour.)
The WSS profiles of all the scaffolds can be compared at the same location (figure 8). The five samples show higher WSS values and more irregular profiles when compared with the CAD scaffold. In addition, from sample to sample the shear stress profile follows a different pattern.
Figure 8.
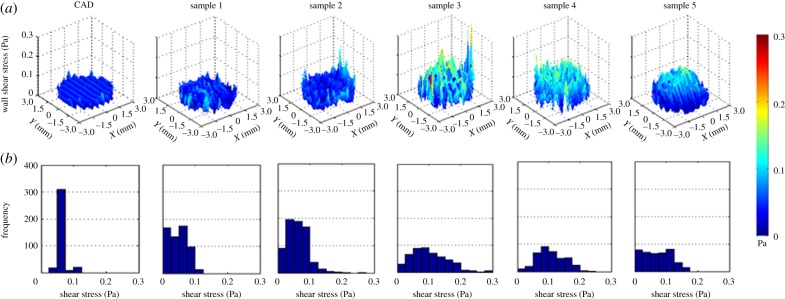
WSS profiles of the CAD scaffold and the five samples in layer 3 (a). Frequency diagram of the WSS values of all the scaffolds at layer 3 (b). Profiles of samples 1 and 2 are the ones with more repeatability in values that are closer to the CAD WSS values; however, the frequencies are widely spread reaching values close 0.3 Pa that are found at the edge of the scaffolds. Samples 3–5 show higher WSS values in the inner part with most repeated values between 0.05 and 0.125 Pa, 0.125 and 0.175 Pa, and 0.05 and 0.1 Pa, respectively. (Online version in colour.)
3.4. Statistical analysis
From the CFD results, herein it is argued that velocities and WSS values vary according to the scaffold sample and the layer within that sample. Thereby pore velocity and WSS values are the dependant variables that would be linked to the sample and layer that are the independent factors. An unbalanced two-way Anova analysis was performed for each dependant variable confirming the significant (p < 0.001) effect of the sample and layer within sample factors on the velocity and WSS profiles.
4. Discussion
Rapid prototyping techniques have demonstrated their feasibility to fabricate tissue engineering scaffolds with controllable architecture [20]. However, limitations of these techniques can affect the final local geometry altering the mechanical environment at the cell level. In this study, five commercial PCL scaffolds from 3D Biotek were used first to investigate the capability of the fabrication method to replicate the original design and reproduce the same geometry from sample to sample and secondly to quantify variations in the local mechanical stimuli due to the resulting geometry. The five µCT-image-based reconstructed samples do not replicate the CAD internal microstructure due to the fabrication process; PCL is preheated to a semi-molten temperature and then extruded through a nozzle depositing the fibres in a layer-by-layer manner. The limitation of this technique is the effect of gravity on the deposited fibres when solidifying plus the need of the fibres to overlap along consecutive layers to ensure layer–layer adhesion. This results in an irregular porous structure with fibre diameter varying from 220 ± 100 μm as also reported in the literature [23]. Furthermore, when the sheets of fibres are solidified punching is applied to obtain the desired cylindrical scaffolds; however, this process damages the side part of the scaffolds and results rather in truncated cone geometry than cylindrical.
At this point, from the structural analysis it is expected that the fluid path and the mechanical stimuli inside the fabricated scaffolds would vary from the design outcomes. To investigate this, a computational methodology was developed to allow the comparison of fluid velocity and WSS profiles of all the scaffolds at the same locations. Laminar fluid flow was applied since most in vitro cell culture studies in the literature show the benefit of laminar conditions in bone tissue development [24,25]. In addition, the calculated Reynolds number at the pores of the scaffolds is 10. The results from the CFD analysis of the CAD showed homogeneous profiles in all layers as all the pores have the same size and only the scaffold inlet and outlet profiles seem slightly different with higher values due to the asymmetry of the boundary conditions. The flow profiles of the five samples do not follow this description. Pore size varies within the samples resulting in heterogeneous velocity and WSS profiles. In addition, a common pattern between samples was not found so there is lack of repeatability.
It is noteworthy that mainly higher velocities and WSS values are found at the periphery of all the scaffolds including the CAD due to the gap between the scaffold side and the wall of the tube that induces the fluid flow to pass through it. The same fixed tube diameter was chosen for all the scaffold simulations so the variation of the scaffold–tube distance could only be due to the scaffold geometry. For the CAD scaffold that distance was constant but in the case of the five samples, the side defects make scaffold–tube distance along the periphery to vary thereby being a high source of variability in the velocity and WSS profiles. This could occur as well when carrying out in vitro experiments; scaffolds are located inside standard commercial tubes with a fixed diameter and gaps could exist if there is scaffold morphological variability. However, no realistic boundary conditions were applied in the simulations since the scope of the study was rather to compare the five scaffolds under the same conditions thus scaffold geometry would be the only source of variability in the CFD analysis. Nevertheless, it has to be considered that µCT scanning could also be a source of error in this study; the fabricated samples were reconstructed from µCT data with voxel size of 7 µm3 increasing the partial-volume effect.
Variations of fluid velocities and WSS values inside scaffolds could promote different cell mechanoresponse throughout the entire structure thereby resulting in newly formed tissue with heterogeneous properties. In the literature, it has been shown that cells respond to shear stress although there is not a clear consensus yet on which values modify cell behaviour. For instance, Zhao et al. [26] observed the developmental properties of three-dimensional human mesenchymal stem cell (hMSC) constructs regulated by perfusion at shear stresses from 1 × 10⁻⁵ to 1 × 10⁻⁴ Pa. Lower values inside this range result in higher proliferation rate and higher shear values upregulate osteogenic differentiation. Some studies have focused on the development of multishear perfusion devices permitting the analysis of cell constructs at different shear stress values. For example, low fluid-induced stresses (1.5–52.6 × 10⁻⁶ Pa) to MCT3T3-E1 cells enhance cell proliferation and differentiation as well as increasing the expression of Runx2, whereas values over 4.12 × 10⁻⁴ Pa inhibit those effects [27]. Another multishear device has been developed to study the response of human umbilical vein endothelial cells to different shear levels ranging from 0 (static) up to 0.9 Pa reporting shear-dependent expression levels of intercellular adhesion molecule-1 and the endothelial nitric oxide synthetase [28]. A different study showed that MSCs differentiate into endothelial cells when subjected to 0.25 Pa shear stress with endothelial cell-related growth factors, whereas under a shear stress of 1 Pa they showed high marker levels related to smooth muscle cells [29]. As can be seen, cell activity under shear stress is still unknown so the WSS variability found in this study inside the samples may potentially vary cell mechano-response. However, it has been shown that cell responses have intrinsic variability under identical conditions [30] which makes it more complicated to assess the actual variability due to scaffold geometry. On the other hand, the fluid velocity variability also found inside the samples can affect scaffold cell seeding resulting in an initial irregular cell distribution that could alter the local flow environment. Furthermore, fluid velocity variability can perturb mass transport properties delivering different nutrient and oxygen concentrations throughout the structure and therefore affecting tissue development. This study still requires further in vitro experimental validation on the same samples that were scanned for the CFD simulations. This would be possible by relating tissue formation in the real scaffold with the local mechanical environment of the digital scaffold calculated in the CFD analysis. The WSS and fluid velocity variability found in the regular-intended scaffold used in this study and the different cell responses due to shear stress reported in the literature add support to the idea that there is a need for inspecting rapid prototyping scaffolds.
This study shows the potential of in silico methods towards scaffold GMP and the successful integration into clinics. The method presented in this study can be part of a standard protocol that complements in vitro tests in order to predict experimental results as well as assessing the variability of the scaffold manufacturing process for tissue engineering applications. In addition, this study can be applied to any rapid prototyping scaffold preventing researchers from the detrimental effect of scaffold geometry variability on tissue development. It is important to understand that a priori insignificant morphological variations observed at the macroscale level cannot be neglected when transferring down to the cell scale. Herein it is argued that the only manner to state that a scaffold has a regular geometry is by proving that there is no unexpected cell response variability. However, even the most regular scaffold at the pore level could present an irregular substrate roughness that provokes different cell behaviour.
5. Conclusion
Variability in scaffold architecture due to limitations during the fabrication process can strongly affect cell mechanical microenvironment. A computational method was developed to characterize scaffold geometry and study the effect of local geometrical variations on the fluid dynamics. Significant intersample variability was found on five samples of a PCL commercial scaffold fabricated by rapid prototyping techniques. This can be a high source of noise to in vitro experiments resulting in heterogeneous cell distribution and response throughout the scaffold and thereby unexpected tissue property outcomes. As this could potentially happen to any rapid prototyping scaffold, it is argued that a more systematic in silico analysis such as the one presented in this study should form part of a standard protocol for any pre-clinical and clinical tests. At the same time, there is a need for rapid prototyping techniques to be certified for GMP which would enable one to deliver repeatable scaffold structure and to achieve the design-intended performance.
Funding statement
Funding from the European Research Council (no. 258321) is acknowledged.
References
- 1.Lee M, Wu BM, Dunn JCY. 2008. Effect of scaffold architecture and pore size on smooth muscle cell growth. J. Biomed. Mater. Res. Part A 87, 1010–1016. ( 10.1002/jbm.a.31816) [DOI] [PubMed] [Google Scholar]
- 2.Karageorgiou V, Kaplan D. 2005. Porosity of 3D biomaterial scaffolds and osteogenesis. Biomaterials 26, 5474–5491. ( 10.1016/j.biomaterials.2005.02.002) [DOI] [PubMed] [Google Scholar]
- 3.Cheung H-Y, Lau K-T, Lu T-P, Hui D. 2007. A critical review on polymer-based bio-engineered materials for scaffold development. Compos. Part B Eng. 38, 291–300. ( 10.1016/j.compositesb.2006.06.014) [DOI] [Google Scholar]
- 4.Xu H, Dong J, Chai G, Yu Z, Lang W. 2010. Rapid prototyped PGA/PLA scaffolds in the reconstruction of mandibular condyle bone defects. Int. J. Med. Robot. 6, 66–72. [DOI] [PubMed] [Google Scholar]
- 5.Park SH, Park DS, Shin JW, Kang YG, Kim HK, Yoon TR, Shin JW. 2012. Scaffolds for bone tissue engineering fabricated from two different materials by the rapid prototyping technique: PCL versus PLGA. J. Mater. Sci. Mater. Med. 23, 2671–2678. ( 10.1007/s10856-012-4738-8) [DOI] [PubMed] [Google Scholar]
- 6.Park S, Kim G, Jeon YC, Koh Y, Kim W. 2009. 3D polycaprolactone scaffolds with controlled pore structure using a rapid prototyping system. J. Mater. Sci. Mater. Med. 20, 229–234. ( 10.1007/s10856-008-3573-4) [DOI] [PubMed] [Google Scholar]
- 7.Hoque ME, Hutmacher DW, Feng W, Li S, Huang M-H, Vert M. 2005. Fabrication using a rapid prototyping system and in vitro characterization of PEG–PCL–PLA scaffolds for tissue engineering. J. Biomater. Sci. Polym. Ed. 16, 1595–1610. ( 10.1163/156856205774576709) [DOI] [PubMed] [Google Scholar]
- 8.Hollister SJ. 2005. Porous scaffold design for tissue engineering. Nat. Mater. 4, 518–524. ( 10.1038/nmat1421) [DOI] [PubMed] [Google Scholar]
- 9.Melchels FPW, Domingos MAN, Klein TJ, Malda J, Bartolo PJ, Hutmacher DW. 2012. Additive manufacturing of tissues and organs. Progr. Polym. Sci. 37, 1079–1104. ( 10.1016/j.progpolymsci.2011.11.007) [DOI] [Google Scholar]
- 10.Arafat MT, Gibson I, Li X. 2013. State of the art and future direction of additive manufactured scaffolds-based bone tissue engineering. Rapid Prototyping J. 20, 13–26. ( 10.1108/RPJ-03-2012-0023) [DOI] [Google Scholar]
- 11.O'Brien FJ. 2011. Biomaterials & scaffolds for tissue engineering. Mater. Today 14, 88–95. ( 10.1016/S1369-7021(11)70058-X) [DOI] [Google Scholar]
- 12.Van Bael S, Kerckhofs G, Moesen M, Pyka G, Schrooten J, Kruth JP. 2011. Micro-CT-based improvement of geometrical and mechanical controllability of selective laser melted Ti6Al4V porous structures. Mater. Sci. Eng. A 528, 7423–7431. ( 10.1016/j.msea.2011.06.045) [DOI] [Google Scholar]
- 13.Domingos M, Chiellini F, Gloria A, Ambrosio L, Bartolo P, Chiellini E. 2012. Effect of process parameters on the morphological and mechanical properties of 3D Bioextruded poly(ε-caprolactone) scaffolds. Rapid Prototyping J. 18, 56–67. ( 10.1108/13552541211193502) [DOI] [Google Scholar]
- 14.Ryan G, McGarry P, Pandit A, Apatsidis D. 2009. Analysis of the mechanical behavior of a titanium scaffold with a repeating unit-cell substructure. J. Biomed. Mater. Res. Part B Appl. Biomater. 90, 894–906. ( 10.1002/jbm.b.31361) [DOI] [PubMed] [Google Scholar]
- 15.Podshivalov L, Gomes CM, Zocca A, Guenster J, Bar-Yoseph P, Fischer A. 2013. Design, analysis and additive manufacturing of porous structures for biocompatible micro-scale scaffolds. Procedia CIRP. 5, 247–252. ( 10.1016/j.procir.2013.01.049) [DOI] [Google Scholar]
- 16.Seitz H, Rieder W, Irsen S, Leukers B, Tille C. 2005. Three-dimensional printing of porous ceramic scaffolds for bone tissue engineering. J. Biomed. Mater. Res. Part B Appl. Biomater. 74, 782–788. ( 10.1002/jbm.b.30291) [DOI] [PubMed] [Google Scholar]
- 17.Wang F, Shor L, Darling A, Khalil S, Sun W, Güçeri S, Lau A. 2004. Precision extruding deposition and characterization of cellular poly-caprolactone tissue scaffolds. Rapid Prototyping J. 10, 42–49. ( 10.1108/13552540410512525) [DOI] [Google Scholar]
- 18.Madi K, Tozzi G, Zhang QH, Tong J, Cossey A, Au A, Hollis D, Hild F. 2013. Computation of full-field displacements in a scaffold implant using digital volume correlation and finite element analysis. Med. Eng. Phys. 35, 1298–1312. ( 10.1016/j.medengphy.2013.02.001) [DOI] [PubMed] [Google Scholar]
- 19.Sandino C, Lacroix D. 2011. A dynamical study of the mechanical stimuli and tissue differentiation within a CaP scaffold based on micro-CT finite element models. Biomech. Model. Mechanobiol. 10, 565–576. ( 10.1007/s10237-010-0256-0) [DOI] [PubMed] [Google Scholar]
- 20.Cioffi M, Boschetti F, Raimondi MT, Dubini G. 2006. Modeling evaluation of the fluid-dynamic microenvironment in tissue-engineered constructs: a micro-CT based model. Biotechnol. Bioeng. 93, 500–510. ( 10.1002/bit.20740) [DOI] [PubMed] [Google Scholar]
- 21.Acosta Santamaría VA, Malvè M, Duizabo A, Mena Tobar A, Gallego Ferrer G, García Aznar JM, Doblare M, Ochoa L. 2013. Computational methodology to determine fluid related parameters of non regular three-dimensional scaffolds. Ann. Biomed. Eng. 41, 2367–2380. ( 10.1007/s10439-013-0849-8) [DOI] [PubMed] [Google Scholar]
- 22.Porter B, Zauel R, Stockman H, Guldberg R, Fyhrie D. 2005. 3-D computational modeling of media flow through scaffolds in a perfusion bioreactor. J. Biomech. 38, 543–549. ( 10.1016/j.jbiomech.2004.04.011) [DOI] [PubMed] [Google Scholar]
- 23.Zermatten E, Vetsch JR, Ruffoni D, Hofmann S, Müller R, Steinfeld A. 2014. Micro-computed tomography based computational fluid dynamics for the determination of shear stresses in scaffolds within a perfusion bioreactor. Ann. Biomed. Eng. 42, 1085–1094. ( 10.1007/s10439-014-0981-0) [DOI] [PubMed] [Google Scholar]
- 24.Grayson WL, Marolt D, Bhumiratana S, Fröhlich M, Guo XE, Vunjak-Novakovic G. 2011. Optimizing the medium perfusion rate in bone tissue engineering bioreactors. Biotechnol. Bioeng. 108, 1159–1170. ( 10.1002/bit.23024) [DOI] [PMC free article] [PubMed] [Google Scholar]
- 25.Rath SN, Strobel LA, Arkudas A, Beier JP, Maier A-K, Greil P, Horch RE, Kneser U. 2012. Osteoinduction and survival of osteoblasts and bone-marrow stromal cells in 3D biphasic calcium phosphate scaffolds under static and dynamic culture conditions. J. Cell. Mol. Med. 16, 2350–2361. ( 10.1111/j.1582-4934.2012.01545.x) [DOI] [PMC free article] [PubMed] [Google Scholar]
- 26.Zhao F, Chella R, Ma T. 2007. Effects of shear stress on 3-D human mesenchymal stem cell construct development in a perfusion bioreactor system. Exp. Hydrodyn. Model. 96, 584–595. [DOI] [PubMed] [Google Scholar]
- 27.Yu W, Qu H, Hu G, Zhang Q, Song K, Guan H, Liu T, Qin J. 2014. A microfluidic-based multi-shear device for investigating the effects of low fluid-induced stresses on osteoblasts. PLoS ONE 9, e89966 ( 10.1371/journal.pone.0089966) [DOI] [PMC free article] [PubMed] [Google Scholar]
- 28.Rotenberg MY, Ruvinov E, Armoza A, Cohen S. 2012. A multi-shear perfusion bioreactor for investigating shear stress effects in endothelial cell constructs. Lab Chip 12, 2696–2703. ( 10.1039/c2lc40144d) [DOI] [PubMed] [Google Scholar]
- 29.Kim DH, Heo S-J, Kim S-H, Shin JW, Park SH, Shin J-W. 2011. Shear stress magnitude is critical in regulating the differentiation of mesenchymal stem cells even with endothelial growth medium. Biotechnol. Lett. 33, 2351–2359. ( 10.1007/s10529-011-0706-5) [DOI] [PubMed] [Google Scholar]
- 30.Eldar A, Elowitz MB. 2010. Functional roles for noise in genetic circuits. Nature 467, 167–173. ( 10.1038/nature09326) [DOI] [PMC free article] [PubMed] [Google Scholar]


