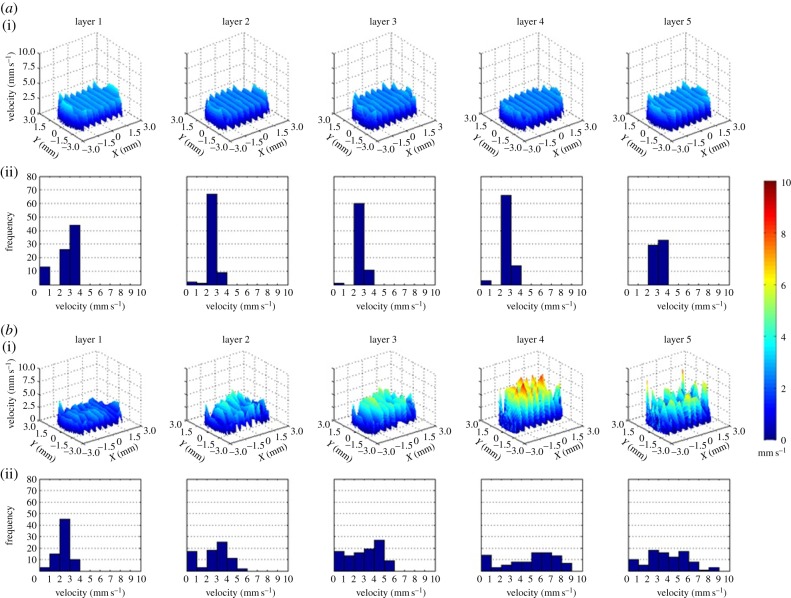
Figure 5.
(a) Velocity profiles of all the layers of pores of the CAD scaffold (i). Frequency diagram of the velocity values of each layer (ii). Profiles in layers 1 and 5 that correspond with the inlet and the outlet of the scaffold present similar profile with velocities found mainly within 2 and 4 mm s−1 values, whereas in the internal layers 2, 3 and 4 the most repeated pore velocities are found in a range from 2 to 3 mm s−1. (b) Velocity profiles of all the layers of pores of one of the fabricated scaffolds (i). Frequency diagram of the velocity values of each layer (ii). Layer 1 seems to agree well with the layer 1 from the CAD scaffold. However, from layer to layer in fabricated scaffold pore velocities vary from close to zero up to 9 mm s−1. The other samples also present irregular pore velocity distribution with variations up to 10 mm s−1. (Online version in colour.)

