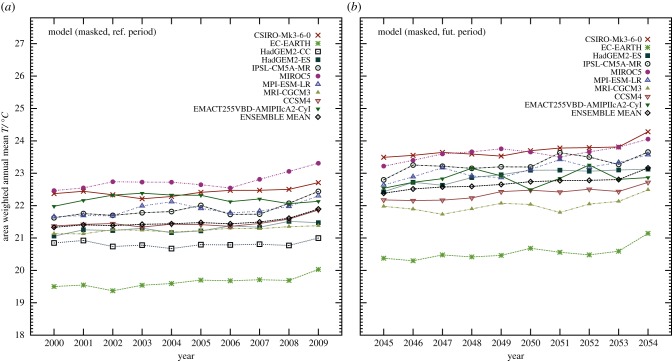
Figure 12.
Area-weighted mean (near-surface) temperature (a) for the recent period 2000–2009 for the CMIP5 ensemble and the interpolated EMAC T255 result, and (b) for the future period 2045–2054. For the comparisons we have masked land areas where the hsi is less than 10%. For a similar comparison that includes the unmasked global values, refer to the electronic supplementary material, figure S23.

