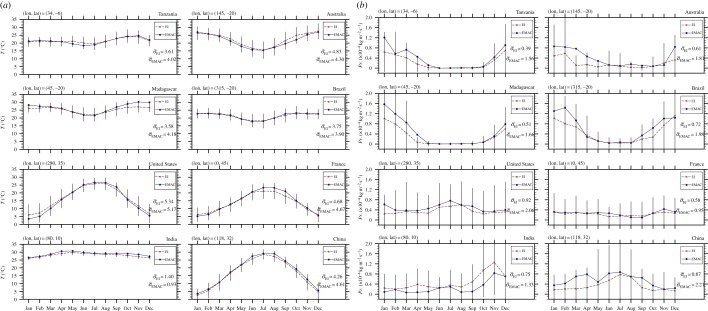
Figure 3.
Monthly climatologies from the ERA-Interim (EI) and the model simulation data over the 2000–2009 period, for selected locations where Ae. albopictus presence is expected. (a) Near-surface temperature and (b) precipitation flux. The vertical axes are on the same scales for better comparison and error bars on the EI values represent two standard deviations. The selected locations are shown with green dots in figure 2.

