
Figure 8.
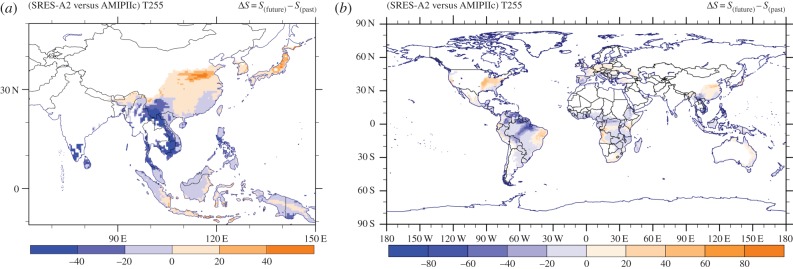
(a) Southeast Asian and (b) global maps of the habitat suitability change between the future and reference periods. Areas with hsi less than 10% have not been considered.
Official websites use .gov
A
.gov website belongs to an official
government organization in the United States.
Secure .gov websites use HTTPS
A lock (
) or https:// means you've safely
connected to the .gov website. Share sensitive
information only on official, secure websites.
(a) Southeast Asian and (b) global maps of the habitat suitability change between the future and reference periods. Areas with hsi less than 10% have not been considered.