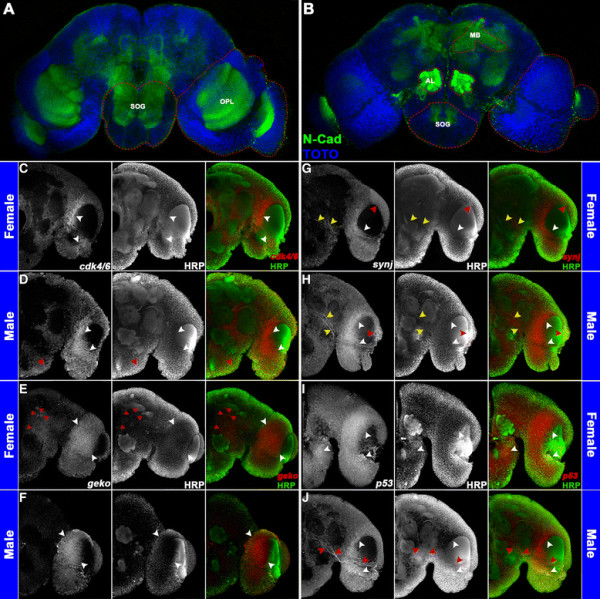
Figure 7.

Sex-specific expression patterns of DETs in theA. aegyptipupal brain. The optic lobe (OPL), antennal lobe (AL), suboesophageal ganglion (SOG), and mushroom body (MB) regions are highlighted by red dots in a whole brain labeled with anti-N-Cadherin (green in A, B) and TOTO nuclear stain (blue in A, B). These regions were assessed through confocal imaging following whole mount in situ hybridization and anti-HRP staining. Five merged Z-stacks (totaling 5 μ) of brain hemisegments oriented dorsal upward (C-J) labeled with anti-HRP staining (center panels in C-J; green in overlays at right) and riboprobes corresponding to the indicated transcripts (left panels in C-J; red in overlays at right) are shown. Differential expression of cdk4/6(C, D), geko(E, F), synj(G, H), and p53(I, J) was detected in 24 h female (C, E, G, I) and male (D, F, H, J) pupal brains. cdk4/6 is commonly expressed in the optic lobe (white arrowheads in C, D), but males have an additional cdk4/6 expression domain in the ventral suboesophageal ganglion (red arrowhead in D). geko, which is commonly expressed in the female and male optic lobe (white arrowheads in E, F), is expressed in additional large cell bodies near the female midbrain and antennal lobe (red arrowheads in E). synj expression is detected in the optic lobe (white/red arrowheads in G, H) and in a subset of midbrain neurons (yellow arrowheads in G, H). Red arrowheads mark sex-specific synj optic lobe expression (G, H), and midbrain synj levels are generally higher in males (compare expression adjacent to yellow arrowheads in G, H). p53 is expressed in the optic lobe and suboesophageal ganglion of females (white arrowheads in I). p53 is also expressed in the male optic lobe (white arrowheads in J), but not in the male subesophageal ganglion. Male-specific p53 expression is detected in neurons adjacent to the antennal lobe (red arrowheads in J). These data are consistent with the results presented in Figure 6.
