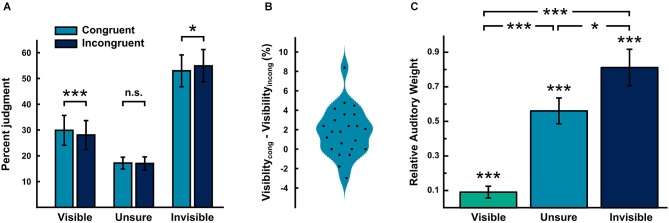
Figure 2.

Behavioral results. (A) Bar plots showing the percentage of flashes judged visible, unsure and invisible for audiovisual spatially congruent and incongruent conditions (across subjects mean ± SEM). Critically, the % judged visible was significantly higher for audiovisual spatially congruent relative to incongruent conditions. (B) Violin plot showing the distribution of the individual differences in percentage of flashes judged visible between the spatially congruent and incongruent conditions. The individual data points are overlaid. (C) Bar plots showing the relative auditory weights (across subjects mean ± SEM) obtained from the regression model separately for visible, unsure and invisible trials. As the regression model (specified in the methods) can only be estimated with at least three trials present for a particular visibility level, the number of subjects varies across the different visibility levels (visible: n = 21; unsure: n = 22; invisible: n = 23).
