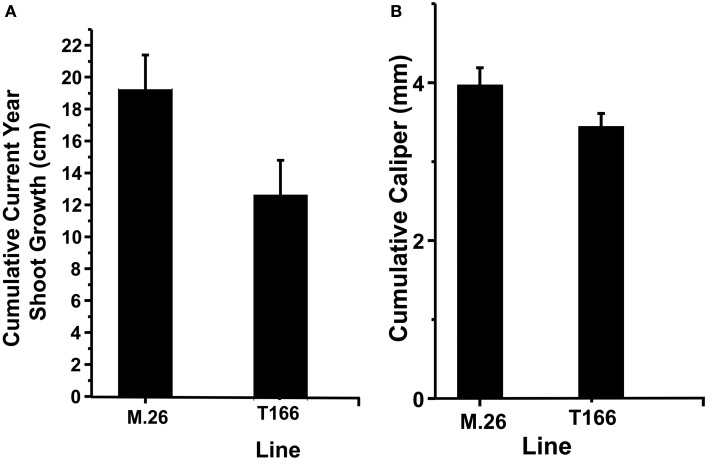
Figure 3.
T166 trees display reduced growth compared to M.26. (A) Cumulative current year shoot growth. Growth was measured on the central axis from the previous season bud scar to the current terminal bud. The cumulative current year shoot growth was significantly different between the genotypes at the 0.05 level as assessed by a two-sample independent t-test. (B) Cumulative caliper (stem diameter) growth as measured 30 cm from the ground. The cumulative caliper growth was significantly different between the genotypes at the 0.05 level as assessed by a two-sample independent t-test.

