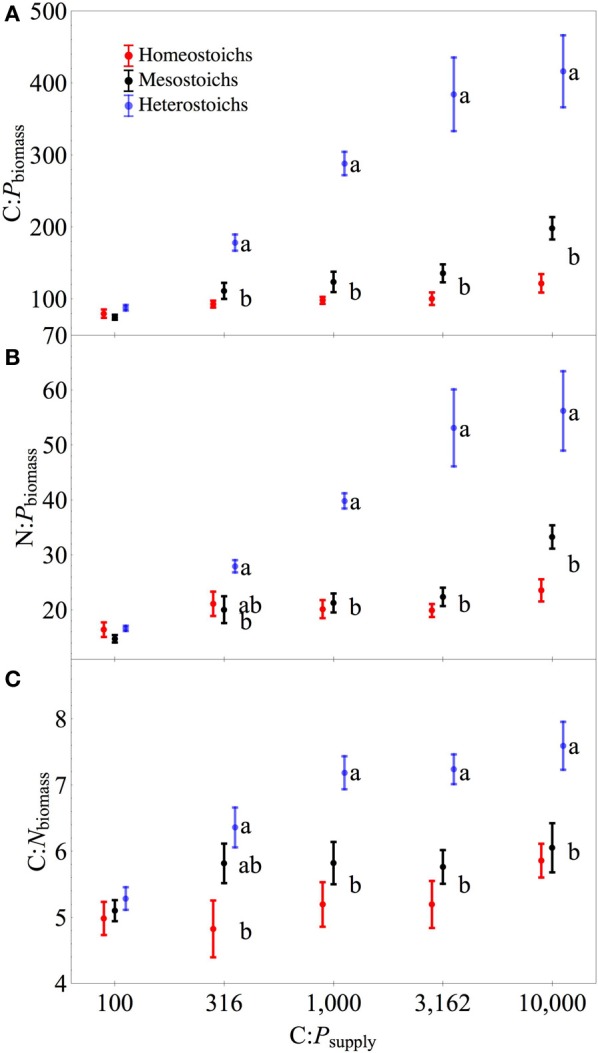
Figure 4.

Biomass stoichiometry of isolates by stoichiometric category. Separate panels for C:P (A), N:P (B), and C:N (C) stoichiometry across C:Psupply. Error bars denote one standard error of the mean. Lower case letters denote significantly different subsets of the stoichiometric categories at each level of C:Psupply (Tukey HSD, p < 0.05). Symbols for each category are staggered horizontally at each level of C:Psupply to improve clarity.
