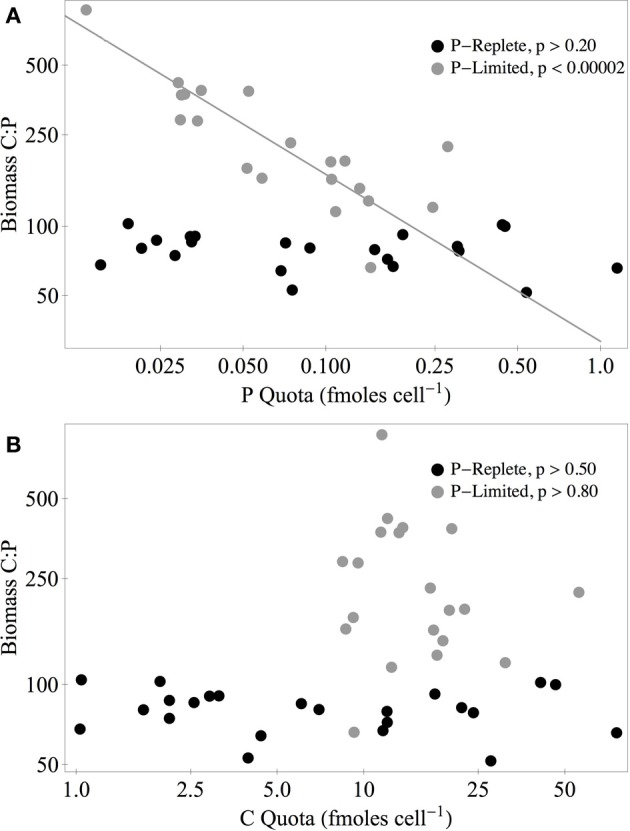
Figure 7.

Biomass C:P vs. P (A) and C quotas (B) of all isolates under P-replete (C:P = 100:1, black circles) and P-limited conditions (C:P = 10,000:1, gray circles). The solid gray line represents the standardized major axis regression (Warton et al., 2006) of log-transformed data. P-values are from ANOVA tests of the regression slope (H0: slope = 0).
