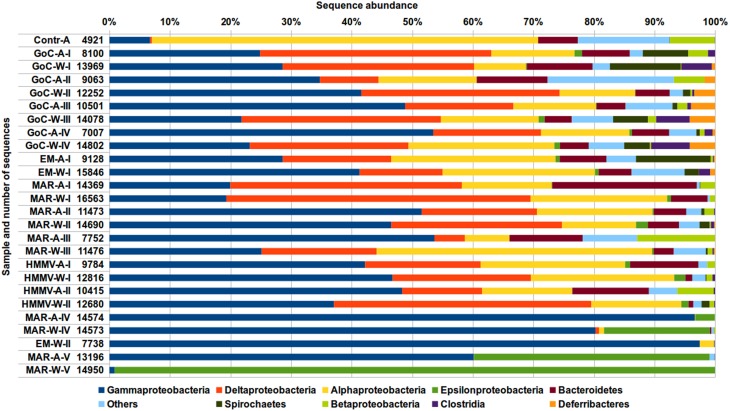
Figure 2.
Composition of bacterial communities at the division or sub-division level based the on V5-V6 region of 16S rDNA gene sequences (OTU identity threshold at 97%). Please refer to Table 1 for sample IDs. Abundances are indicated as percentage of total sequences in each sample (numbers close to sample ID's).

