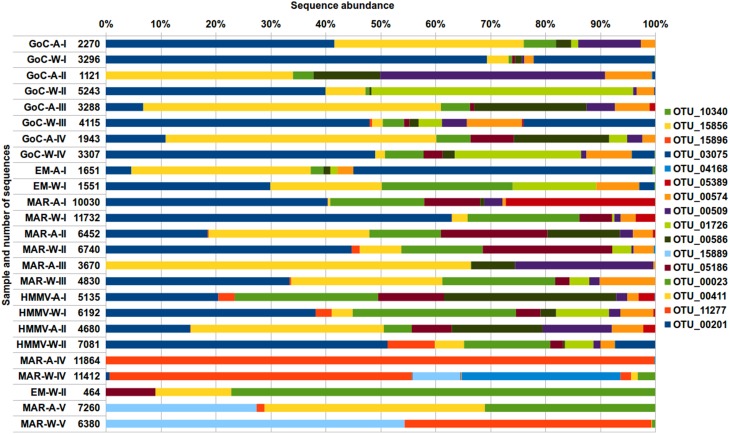
Figure 3.
Percentage of pyrosequencing reads representing the most abundant OTUs (more than 1% of the total number of sequences, i.e., >3000 reads) and assigned to different bacterial phylotypes. Taxonomic classification was based on comparison of sequences within the SILVA database with OTU identity threshold at 97%. More details on taxonomic assignment of OTUs analyzed is provided in Table S3. Refer to Table 1 for sample ID.

