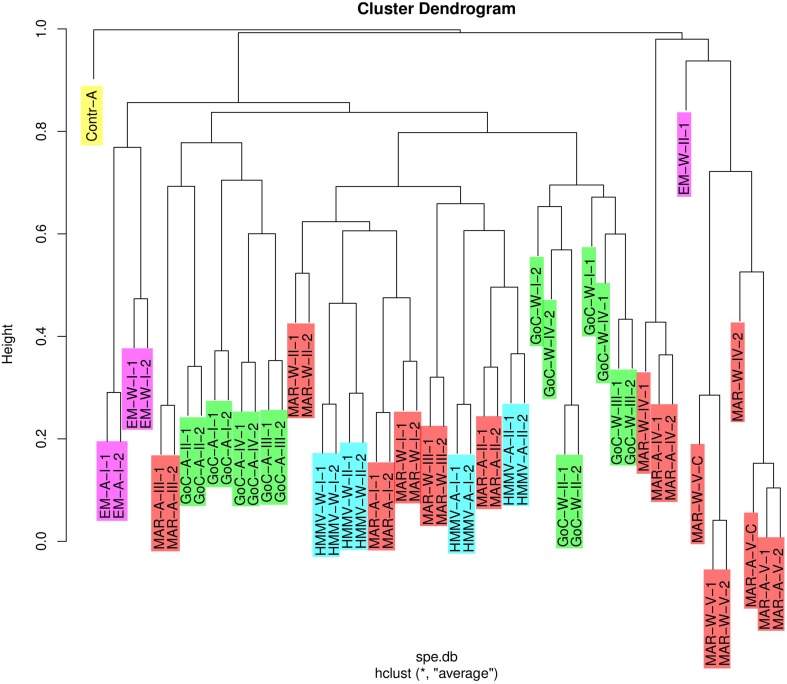
Figure 4.
Dendrogram for average agglomerative clustering generated in R (R Development Core Team, 2013) using Unweighted Pair-Group Method with arithmetic Average (UPGMA) on a Bray-Curtis distance matrix (“hclust()” function in stats package). The dendrogram is rooted on the negative alfalfa control (Contr-A-I). Sample IDs are described in Table 1. Color code is the same as that used in Figure 1.

