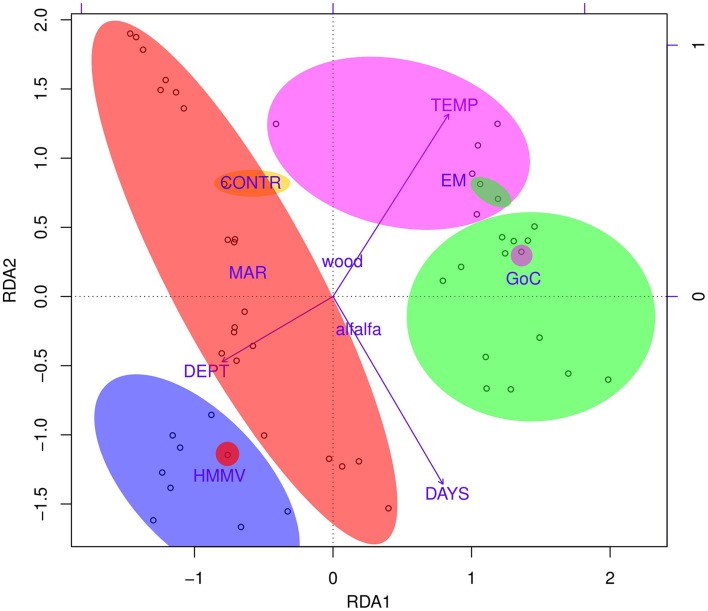
Figure 5.
RDA biplot of the Hellinger-transformed OTU abundance data constrained by all environmental variables, scaling 3. Substrate type [factor(SUBS)] and region [factor(REG)] were used as factors and water temperature (TEMP), depth (DEPT), and deployment time (DAYS) were used as variables into the constrained RDA, generated in R using “rda()” and “plot()” functions in “vegan” package. Geographic areas are indicated by ellipses with color corresponding to region of origin. Color code follows that of Figures 1, 4. Sample IDs of individual points can be found in Figure S4 and environmental variables and factors are described in Table 1. The influence of each variable and factor and their significance were assessed using ANOVA permutation tests—details in Table S4.

