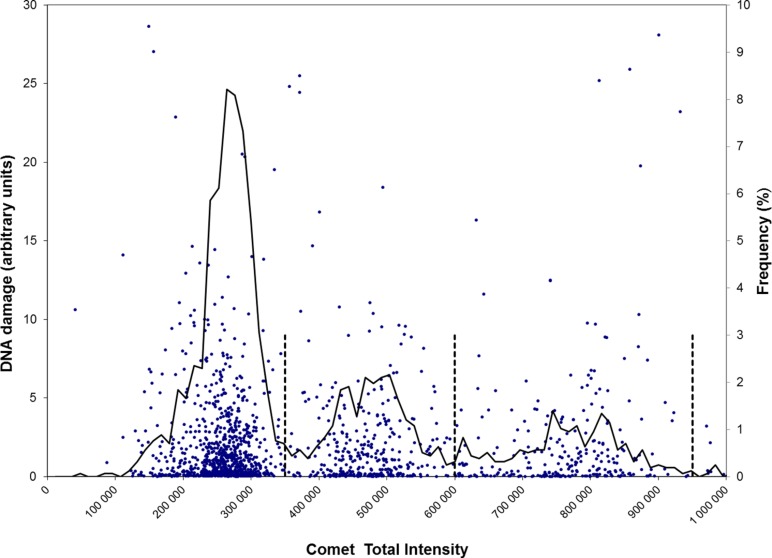
FIGURE 1.
Scatter plots of DNA damage of cells of different ploidy. Each single cell (with varying tail size) is scored for DNA damage together with its total fluorescence intensity (TFI). DNA damage (left vertical axis) and TFI (horizontal axis) were determined for 1600 control cells (dots) prepared from a human testicular biopsy. The stippled vertical lines indicate the partitions of three different populations of cells, of ploidy 1n, 2n, and 4c (discriminated at fluorescence intensity 350 000, 600 000, and 950 000, respectively). The mean intensities of cells within these classes are 255 000, 471 000, and 761 000 for 1n, 2n, and 4c, respectively. Mean levels of DNA damage (TM) are in the range 2.2–2.5 for the three classes and are not significantly different. Plotted line: mean frequency (%, right vertical axis) of DNA damage at each intensity level.

