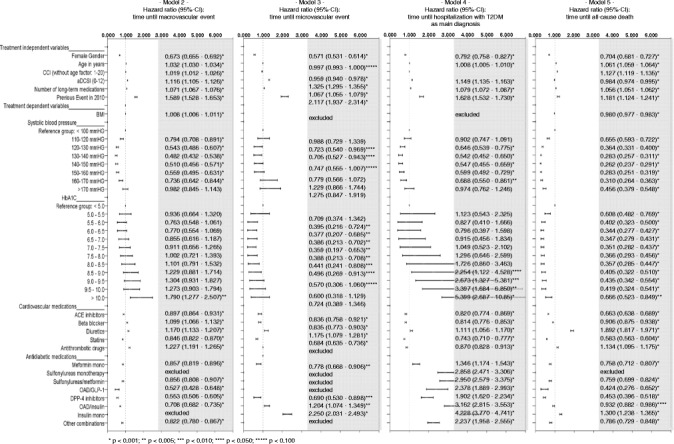
Figure 4.

Factors associated with risk of different events (models 2–5). The figure compares the results of the multivariable analyses with regards to chosen independent factors being potentially associated with time until a macrovascular event (model 2), a microvascular event (model 3), a diabetes type 2-related hospitalisation (model 4) and all-cause death (model 5) in the whole study sample.
