Figure 4.

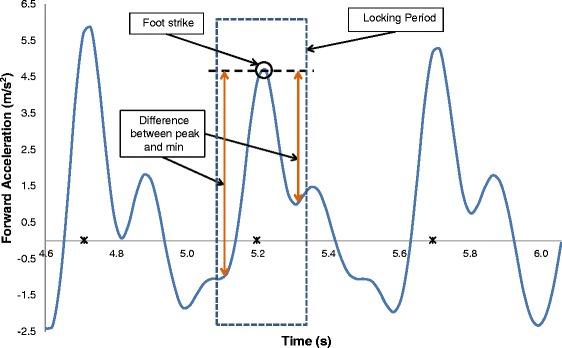
Step detection. The dashed square represents the locking period, the circle is the detected peak and the arrows indicate the difference between the peak and min on either side. Asterisks represent foot strikes.

Step detection. The dashed square represents the locking period, the circle is the detected peak and the arrows indicate the difference between the peak and min on either side. Asterisks represent foot strikes.