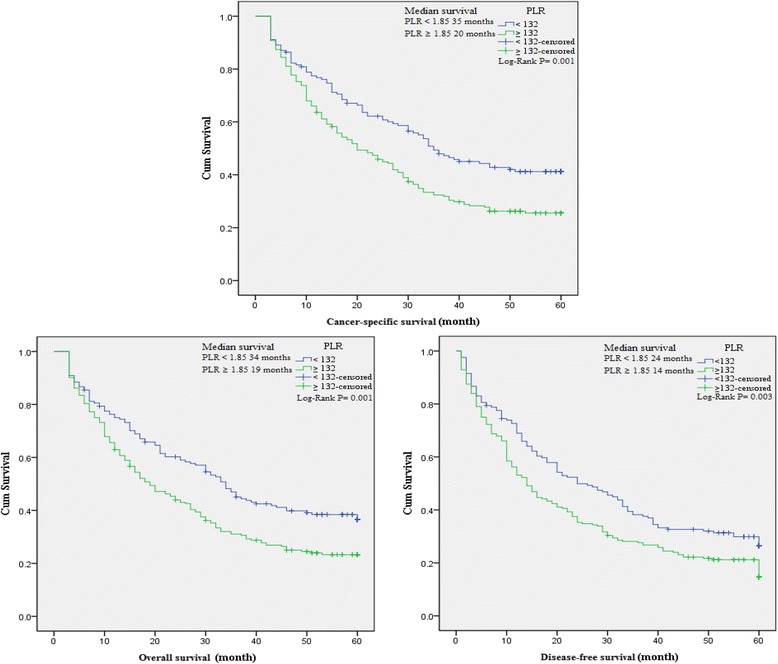
Figure 5.

Kaplan-Meier curves for overall, cancer-specific and disease-free survival probability according to NLR, dNLR, PLR and LMR level. There was a significantly shorter overall, cancer-specific and disease-free survival in the group with PLR ≥ 132 than the group with PLR < 132.
