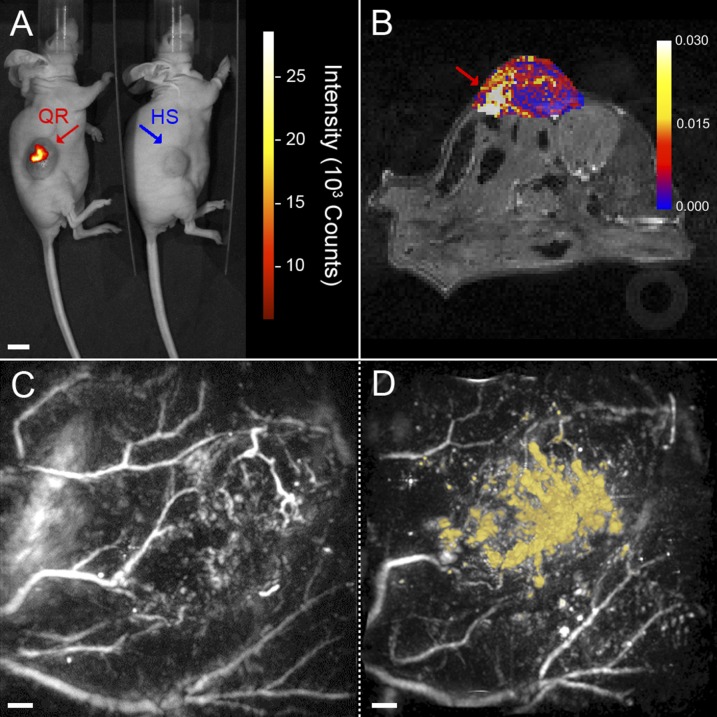
Fig. 4.
Multimodal in vivo imaging of QRs in a LS174T-luc tumor model in CD1 nu/nu mice. (A) NIR fluorescence image showing focal points of fluorescent intensity where QRs (red) were injected in the tumor compared with nonfluorescent hollow mesoporous silica shells control (HS, blue). (Scale bar, 10 mm.) (B) Image showing the change in longitudinal relaxation rate (R1) from baseline following injection of QRs. A focal point of increased R1 is visible inside the tumor (red arrow), coinciding with the point of injection. (C and D) Horizontal maximum intensity projections (x–y) of 3D photoacoustic images (14 × 14 × 6 mm3) of a tumor acquired at 670 nm before (C) and after (D) injection of QRs. The contrast provided by the QRs in the postinjection image is false-colored yellow. An animated volume-rendered image of the data set visualized in D is also available as Movie S2. (Scale bars, 1 mm.)

