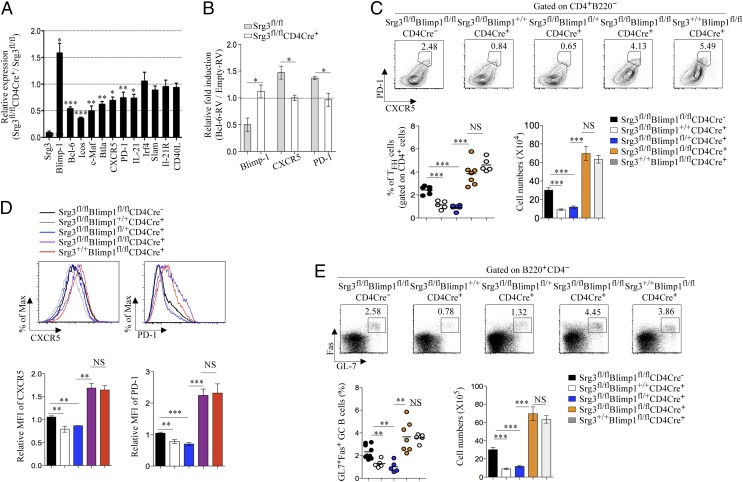
Fig. 6.
The deletion of Blimp-1 rescues the perturbed differentiations of TFH and GC B cells in Srg3fl/flCD4Cre+ mice. (A) CD4+ T cells of Srg3fl/fl CD4Cre+ mice were stimulated for 24 h with anti-CD3 and anti-CD28 in the presence of IL-6, anti–IL-4, anti–IFN-γ, and anti–TGF-β, followed by quantitative RT-PCR analysis for the expression of genes involved in differentiation or function in TFH cells; results are presented relative to those of CD4+ T cells of Srg3fl/fl mice. Data are presented by mean and SEM; *P < 0.05, **P < 0.01, ***P < 0.001. n = 4–8. (B) CD4+ T cells of Srg3fl/fl or Srg3fl/flCD4Cre+ mice were transduced with Empty-RV or Bcl-6–RV after 18-h activation with anti-CD3 and anti-CD28 and further cultured in condition as described in A. After 48 h, GFP+ cells were purified by flow cytometry and expression of Blimp-1, CXCR5, and PD-1 was analyzed by quantitative RT-PCR; results in CD4+ T cells transduced with Bcl-6–RV are presented as fold induction relative to those in CD4+ T cells transduced with Empty-RV. Data are presented as mean and SEM; *P < 0.05. n = 3–4. (C) Flow cytometry of CXCR5+PD-1hi TFH cells obtained from the spleen of NP-KLH–immunized mice on day 7. The statistical quantitation of frequency in CD4+ T cells and cell numbers for CXCR5+PD-1hi TFH cells was analyzed. Each individual dot represents one mouse and data are presented as mean and SEM. (D) CXCR5 and PD-1 expressions in CD4+ cells. Bar graphs show mean fluorescent intensity of CXCR5 (Left) and PD-1 (Right). (E) Flow cytometry of GC B cells obtained from the spleen of NP-KLH–immunized mice on day 7. Cells gated on CD4−B220+ were analyzed for the expression of Fas and GL-7 (Upper). Numbers adjacent to outlined area indicate the percentage of populations. The statistical quantitation of frequency in CD4−B220+ B cells and cell numbers for CXCR5+PD-1hi TFH cells (Lower) was analyzed.

