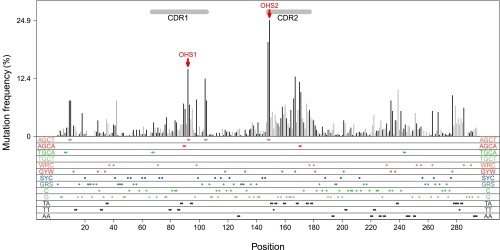
Fig. 1.

Demonstration of the mutation distribution of IGHV3-23*01 in vivo. The database includes V regions that are mutated (264) and not mutated (174). Each CDR3 was unique; they are not shown here. The x axis shows the mutation sites within the V region. The y axis is the mutation frequency for each site. Black lines show the mutation frequencies that occurred at G:C sites. Gray lines demonstrate the mutation frequencies at A:T sites. Each colored dot in the bottom panels represents an AID hot/cold/neutral spot or Polη hotspot, as labeled at both edges. Double dots are AID overlapping hotspots (WGCW) or two adjacent Polη hotspots. The red arrows point to the OHS1 and OHS2 overlapping hotspots, as labeled. Horizontal gray bars on top are CDRs as labeled.
