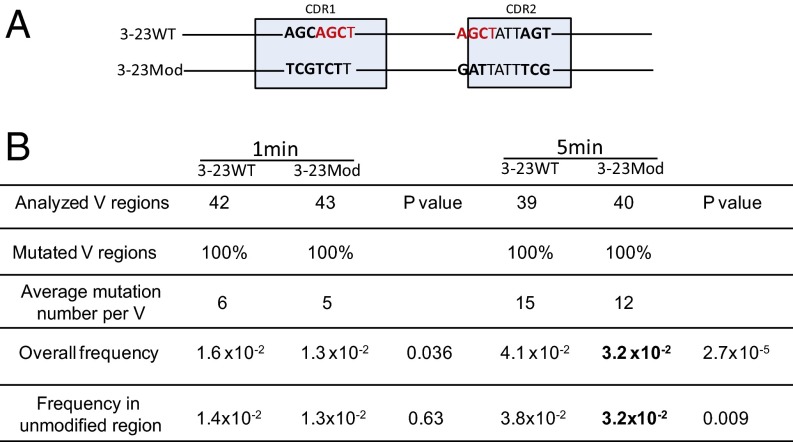
Fig. 4.
In vitro analysis. (A) DNA modification schematic in which 3-23WT is the IGHV3-23*01 WT germ line DNA sequence and 3-23Mod shows the modified IGHV3-23*01 DNA sequence. The highlighted nucleotides in red are the AGCT sites in CDR1 and CDR2. The bold nucleotides are the differences between 3-23WT and 3-23Mod DNAs. The 6-bp AGCAGC in CDR1 of 3-23WT are changed to TCGTCT in 3-23Mod, and another 6-bp AGC...AGC in CDR2 of 3-23WT are changed to GAT...TCG in 3-23Mod. The light blue boxes mark the CDRs as labeled but are not drawn to scale. (B) Mutation frequency generated by the in vitro assay. This table shows the untranscribed (Top) strand DNA mutation frequencies after 1- and 5-min incubations with AID, as labeled on the top of the table. The first row shows the number of V regions sequenced, and the second row tells the percentage of the mutated V regions in the number of the first row. “Average mutation number per V” shows the total mutations divided by number of mutated V regions. “Overall frequency” shows the total mutation frequencies in all of the V regions shown in the first row (mutations/bp). “Frequency in unmodified region” refers to the mutation frequency in the V region excluding the modified area. P values are shown after each comparison between 3-23WT and 3-23Mod and calculated in SHMTool, as described in ref. 76. The bold numbers show the significantly decreased values in 3-23Mod compared with 3-23WT.

