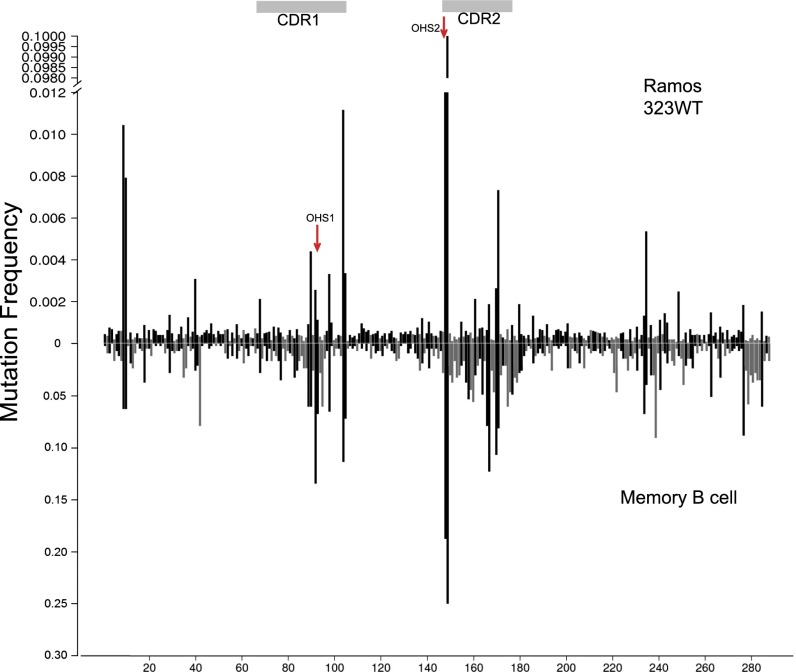
Fig. 5.
Comparison of the mutation pattern of IGHV3-23*01 in Ramos cell lines (Ramos 3-23WT) with that from memory B-cell database (memory B-cell). The y axis shows the mutation frequency. (Upper) Y axis is gapped from 0.012 to 0.098 and is a different scale than in the lower panel because of the lower overall frequency of mutations and the relatively higher frequencies in OHS2 in Ramos. CDRs are showed in the gray horizontal boxes. Black lines and gray vertical bars represent G:C and A:T mutations frequencies, respectively. Red arrows point to OHS1 and OHS2.

