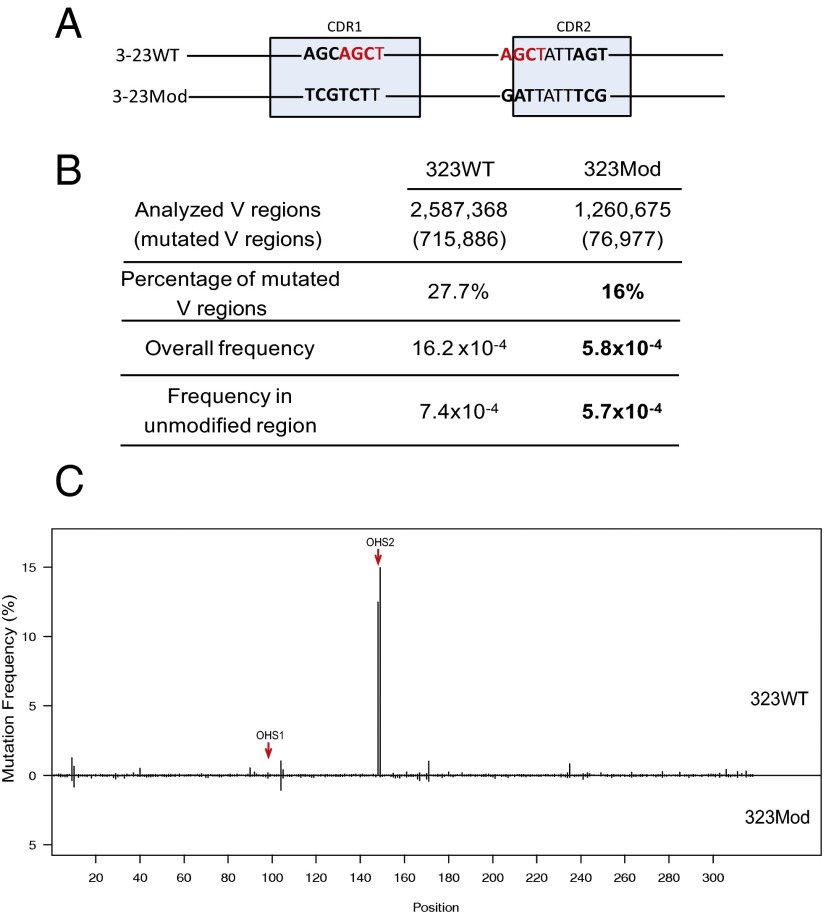
Fig. 6.
DNA modification in both CDR1 and CDR2 changed the mutation frequency of V region in Ramos. (A) DNA modification schematic is the same as shown in Fig. 4A. (B) Mutation analysis in 3-23WT Ramos subclones and DNA-modified Ramos subclones (3-23Mod). The first column has the values from a pool of all of the V regions of five 3-23WT subclones, and the second column contains the values from a pool of five 3-23Mod subclones. The first row shows the numbers of the total V regions obtained from the deep sequencing for 3-23WT and 3-23Mod. In the parenthesis are the numbers of mutated V regions. The second row has the percentages of mutated V regions in total V regions shown in the first row. “Overall frequency” represents the mutations in all of the V regions (shown in the first row) that occurred throughout the whole V region, including the mutations that occurred in the modified regions, calculated in SHMTool (76). “Frequency in unmodified region” shows the mutation rates after the mutations in the modified area (12-bp differences totally in CDR1 and CDR2 between 3-23WT and 3-23Mod) are excluded from 3-23WT and 3-23Mod V regions, and they are also calculated in SHMTool. Bold values in 3-23Mod for mutation frequencies are significantly decreased values compared with 3-23WT (P < 10−6, calculated by SHMtool). The bold numbers are percentage of mutated V regions, the P value is <0.001 (χ2 test). (C) Mutation distribution comparison between 3-23WT and 3-23Mod. Upper part is 3-23WT, lower part is 3-23Mod, as labeled. The x axis gives the site for each mutation of V region. The y axis shows the mutation frequency for each site. Each vertical line represents the mutation frequency at the corresponding site, as labeled in x axis. Red arrows point to OHS1 and OHS2.

