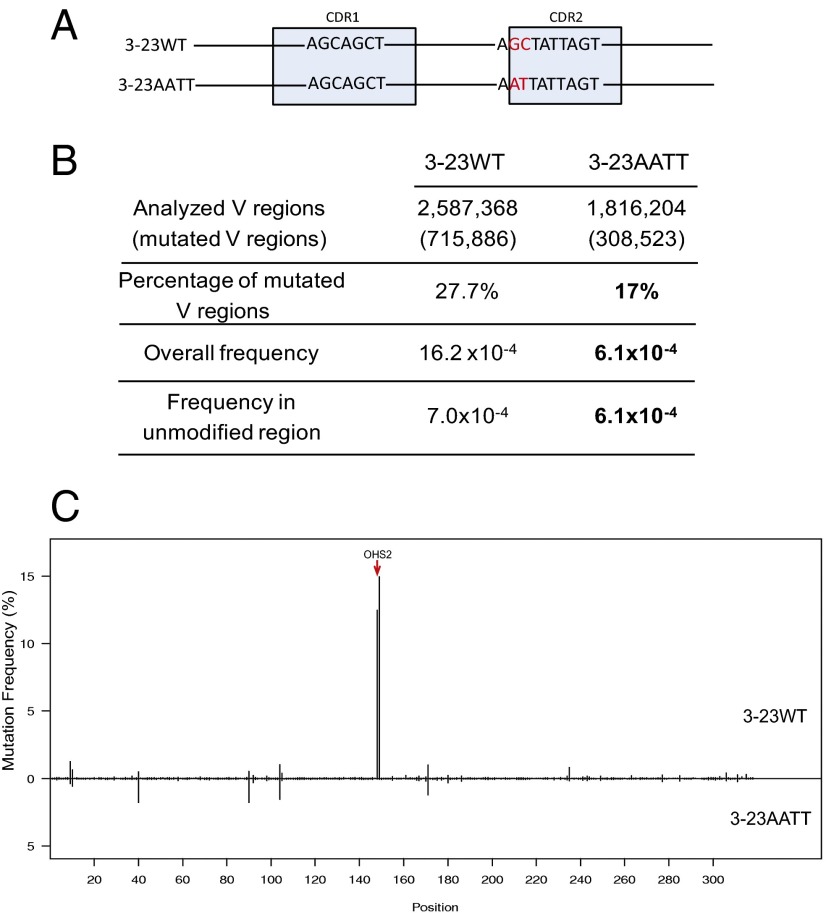
Fig. 7.
DNA modification in OHS2 changed the mutation frequency in Ramos. (A) DNA modification schematic: 3-23WT represents IGHV3-23*01 WT germ line DNA sequence, and 3-23AATT shows the GC sites of OHS2-modified IGHV3-23*01 DNA sequence. The highlighted nucleotides are the differences between 3-23WT and 3-23Mod. The light blue boxes mark the CDRs as labeled. (B) Mutation analysis in V regions of 3-23WT and DNA modified 3-23AATT subclones. The first column has the values obtained from the same V regions as in Fig. 6B because the experiments in Figs. 6 and 7 were done in parallel. The second column contains the values from the combination of the V regions from four 3-23AATT subclones. The rows showed the numbers obtained by the same analysis as in Fig. 6B for 3-23AATT. Bold values in 3-23AATT for mutation frequencies are significantly decreased values compared with 3-23WT (P < 10−6, calculated by SHMtool). In the bold values for percentage of mutated V regions, the P value is <0.001 (χ2 test). Here the modified area only includes GC sites in OHS2. (C) Mutation distribution comparison between 3-23WT and 3-23AATT. The upper part is 3–23WT, and the lower part is 3–23AATT. The rest is the same as described in Fig. 6C. Red arrow points to OHS2.

