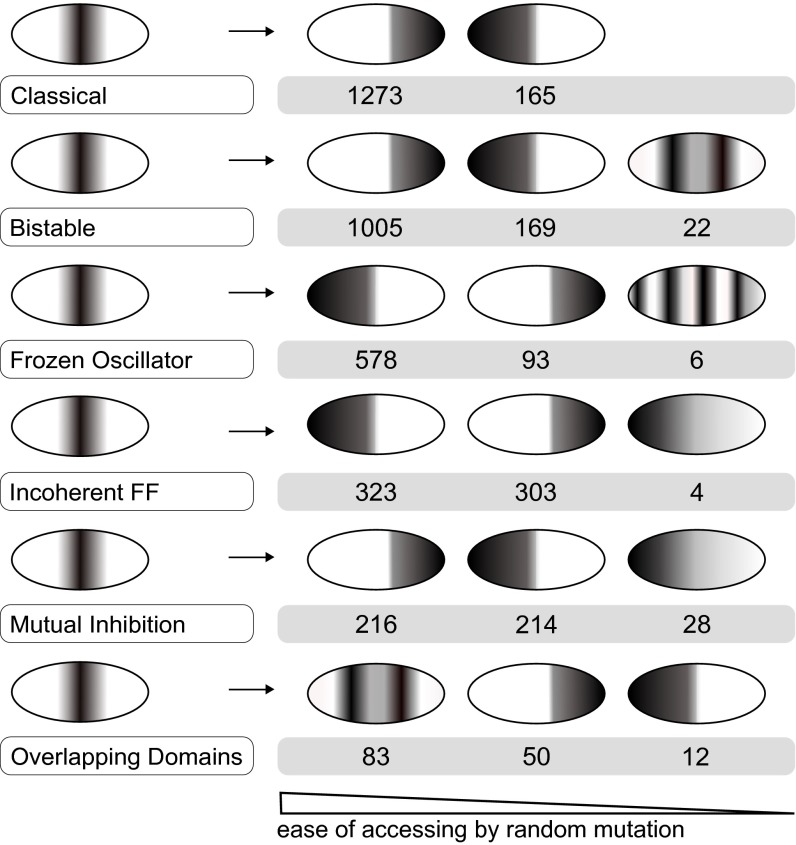
Fig. 3.
Differences in evolvability: schematics of novel phenotypes. Evolutionary potential is shown as the number of mutations out of 10,000 that permit access to distinct novel phenotypes. Values correspond to 50% mutation strength. Phenotypes accessible with a frequency below 1/10,000 (0.01% chance to be accessed through random mutation) are not considered. The accessibility to Gradient, Double Peak, and Multiple Stripes phenotypes is mechanism dependent.

