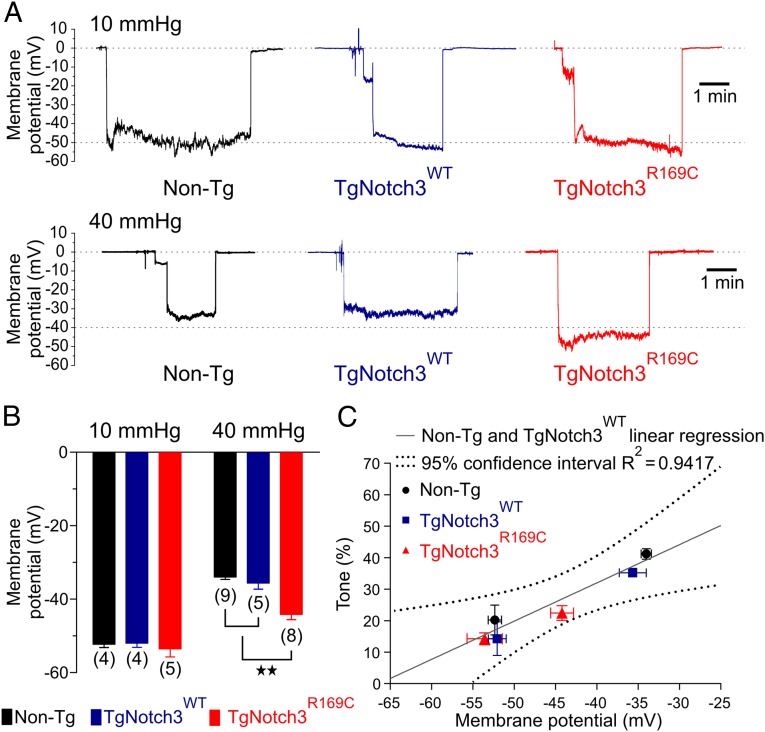
Fig. 2.
The membrane potential of PAs from CADASIL mice are more hyperpolarized at 40 mmHg. (A) Membrane potential (mV) of SMCs in pressurized PAs at 10 mmHg (upper traces) and 40 mmHg (lower traces). (B) Membrane potential summary data at 10 mmHg and 40 mmHg, expressed as means ± SEM recorded in three different cells (**P < 0.01; one-way ANOVA). The number of animals is shown in parentheses. (C) Percentage of myogenic tone induced by 10 mmHg and 40 mmHg and plotted as a function of membrane potential. Values from TgNotch3R169C animals are consistent with the linear regression obtained from Non-Tg and TgNotch3WT animals, showing a similar relationship between tone and membrane potential.

