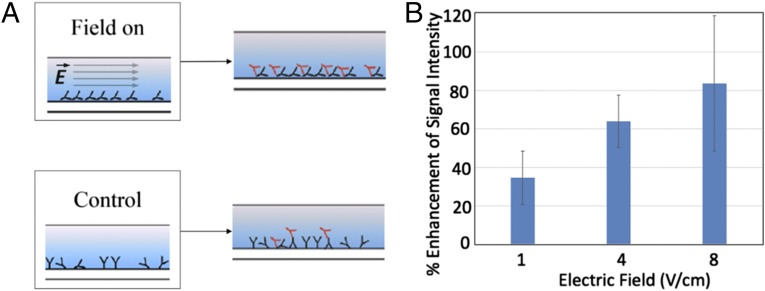
Fig. 5.
(A) Experimental setup for the fluorescence assay (including the control experiment). The electric field is applied during the IgG immobilization step. The immobilized IgG molecules then target the subsequently injected FITC-labeled anti-IgG molecules. (B) Improvement in signal intensity of the anti-IgG-IgG assay, with respect to the control experiment (no field applied), as a result of applying electric field during the IgG immobilization step. Error bars represent the SE in our measurements.

