
Fig. 5.
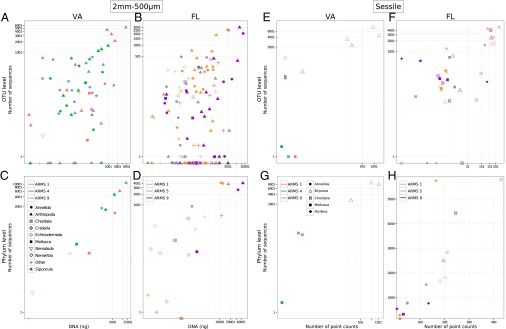
Relationship between the number of sequences per OTU (A, B, E, and F) or per phylum (C, D, G, and H) obtained via metabarcoding and the total amount of DNA (2-mm to 500-μm samples; A–D) or plate coverage (sessile taxa; E–H).
Official websites use .gov
A
.gov website belongs to an official
government organization in the United States.
Secure .gov websites use HTTPS
A lock (
) or https:// means you've safely
connected to the .gov website. Share sensitive
information only on official, secure websites.
Relationship between the number of sequences per OTU (A, B, E, and F) or per phylum (C, D, G, and H) obtained via metabarcoding and the total amount of DNA (2-mm to 500-μm samples; A–D) or plate coverage (sessile taxa; E–H).