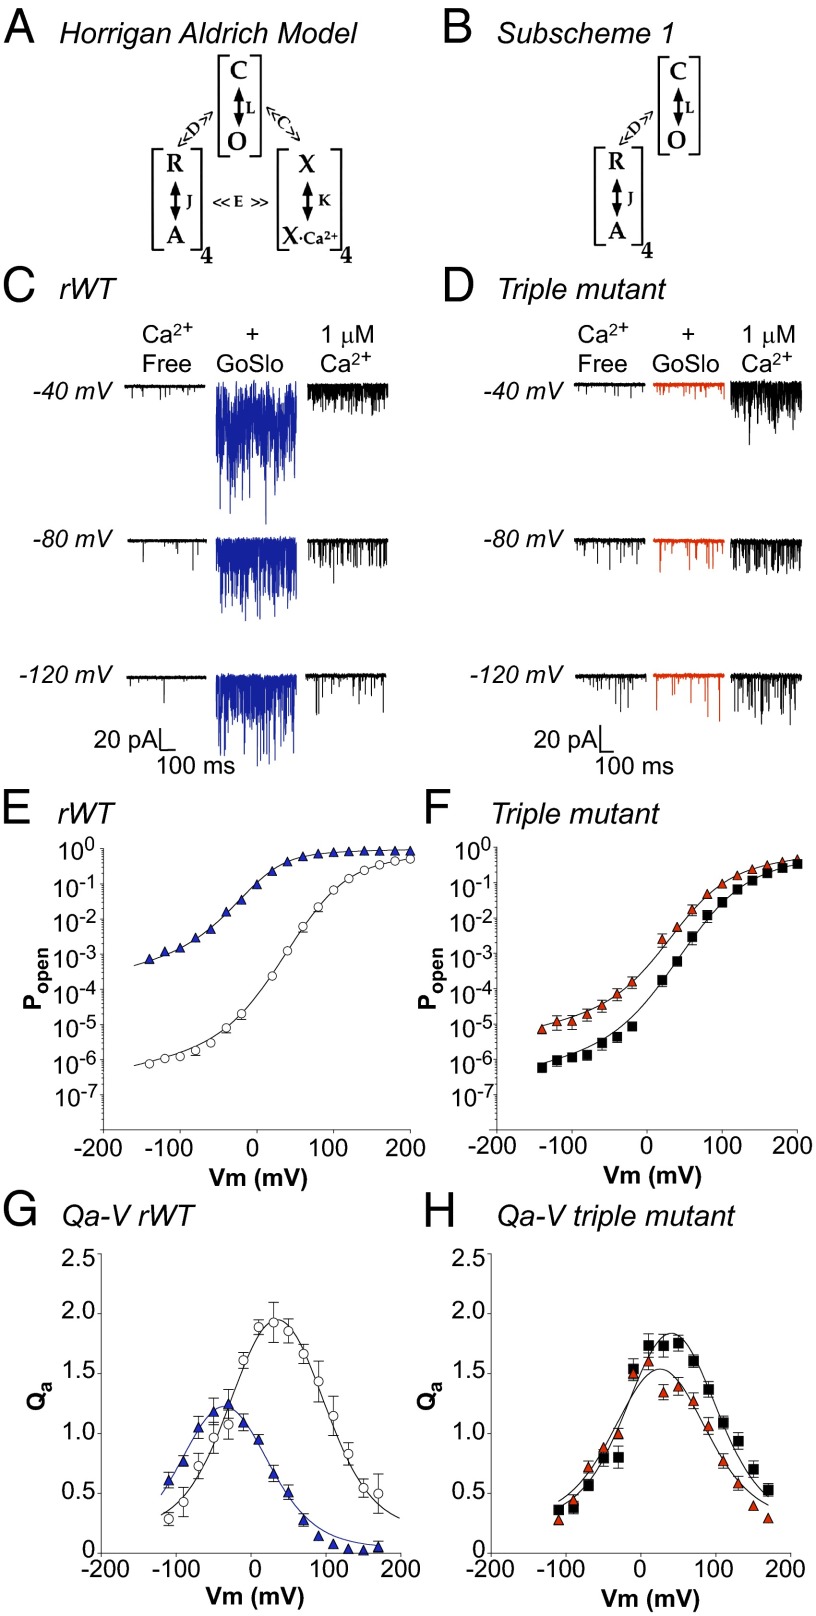
Fig. 6.
Using the HA model to assess the molecular mechanisms of action of GoSlo. (A) The HA model in which C and O represent the closed and open states of the channel and is governed by the equilibrium constant L. R and A represent the resting and activated states of each of the four voltage sensors and is governed by the equilibrium constant J. X and XCa2+ are the unbound and bound states of the Ca2+ sensors, respectively, and K is the equilibrium constant. C and E represent the allosteric factors that couple Ca2+ binding to channel opening and voltage sensor activation, respectively, and allosteric factor D couples channel opening and voltage sensor activation. (B) HA model applicable in the absence of Ca2+. (C, E, and G) Typical records and summary data from rWT BK channels. D, F, and H show experiments with the triple (L227A:I326A:317R) mutant. C shows single-channel currents from a WT patch containing 180 channels and held at −40, −80, and −120 mV in the absence of Ca2+ (left traces), the presence of GoSlo (middle traces), and 1 μM Ca2+ (right trace). GoSlo was more effective at increasing the PO than Ca2+ at negative voltages. Summary data in E shows mean PO–V relationships in the absence (open circles) and presence (blue triangles) of GoSlo (10 μM). Solid lines are fits obtained with Eq. S3, which yielded L0 = 3.7 × 10⁻⁶, ZL = 0.28, J0 = 0.09, ZJ = 0.73, and D = 13.8 before, and L0 = 2.5 × 10⁻³, ZL = 0.28, J0 = 0.7, ZJ = 0.71, and D = 5 in GoSlo. (G) Mean Qa–V relationship for rWT, where QaMAX was 1.95 ± 0.14 at 30 mV in control compared with 1.17 ± 0.13 in GoSlo. (D) Currents from a patch containing 350 triple mutant channels in the absence (Left), presence of GoSlo (Middle) and 1 μM Ca2+ (Right). F shows PO in triple mutant before (black squares) and during GoSlo (red triangles). Solid lines are fits obtained with Eq. S3, where L0 = 3.6 × 10⁻⁶, ZL = 0.3e, J0 = 0.08, ZJ = 0.7, and D = 11 in control, and L0 = 3.9 × 10⁻⁵, ZL = 0.28, J0 = 0.17, ZJ = 0.69, and D = 7 in GoSlo (red triangles). (H) Mean Qa–V relationship of the mutant before (black squares) and during GoSlo (red triangles), where QaMAX was reduced from 1.76 ± 0.07 at +50 mV to 1.4 ± 0.07 at +50 mV. Solid lines represent fits to the data using Eq. S6 and yielding the values quoted in Table S2.

