Fig. 2.

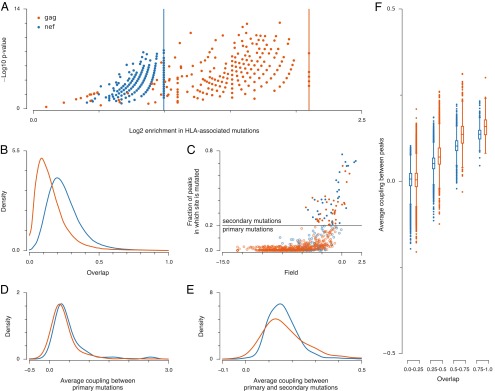
Fitness peaks in the highly immunogenic proteins Gag and Nef exhibit similar properties. (A) All 402 fitness peaks in Gag and 491 fitness peaks in Nef are enriched in HLA-associated mutations (SI Text). Enrichment values are defined as the fraction of HLA-associated mutations in a peak sequence divided by the fraction of HLA-associated mutations in the whole protein. Vertical lines indicate maximum enrichment values, obtained if all mutations present in a peak sequence are HLA-associated. P values express the probability of obtaining at least as many HLA-associated mutations as actually observed in each peak sequence, assuming that these mutations were selected by chance (SI Text). Small P values suggest that HLA enrichment is not by chance. (B) Most peaks are distinct, with little overlap between sets of mutations in other fitness peaks. We define overlap as the number of mutations that the peak sequences have in common divided by the total number of mutations in both peak sequences combined. (C) We refer to mutations that occur in <20% (>20%) of fitness peaks as primary (secondary) mutations. Only a small fraction of sites are classified as secondary mutations (35 for Gag, 32 for Nef). Secondary mutations typically have small fields hi, suggesting low fitness costs. (D) Average couplings between primary sites mutated within each peak sequence are strongly positive. (E) Average couplings between primary and secondary sites mutated in each peak sequence are weaker than those between primary sites alone, but mostly positive. (F) Average couplings between mutated sites in pairs of peaks are positive (compensatory) when the peaks strongly overlap, becoming more negative (deleterious) when the peaks are disjoint. Box plots describe the distribution of couplings between pairs of peak sequences grouped according to their overlap (SI Text).
