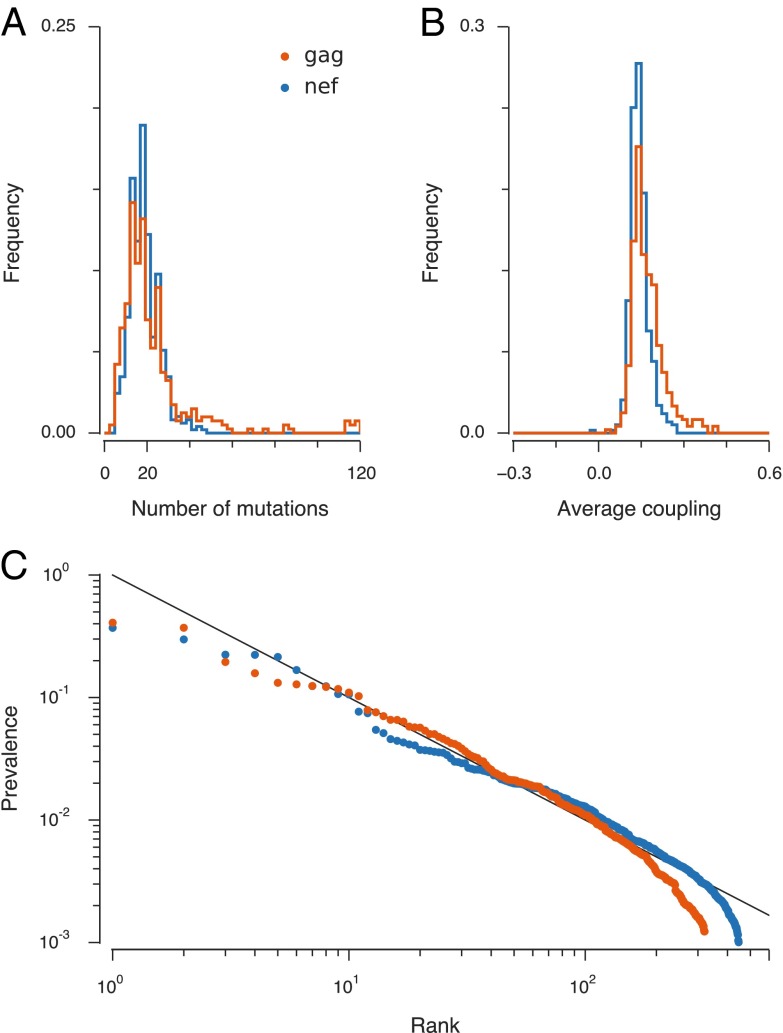
Fig. 3.
Scaling laws for immunogenic proteins can be recovered qualitatively through a simple model of viral growth incorporating the number of mutations and average coupling between sites in each peak sequence. (A) The distribution of the number of mutations in peak sequences in the Gag and Nef proteins. (B) The distribution of average couplings between mutated sites in peak sequences is centered around positive values. (C) A simple model of viral growth (Eq. 4) approximately reproduces the power law distribution of sequences across fitness peaks for Gag and Nef, with an exponential tail for high-ranked peaks. Here, the normalization of the prevalence (proportional to the number of sequences lying on each fitness peak) is arbitrary. For comparison, a power law with exponent 1 is shown in the background.

