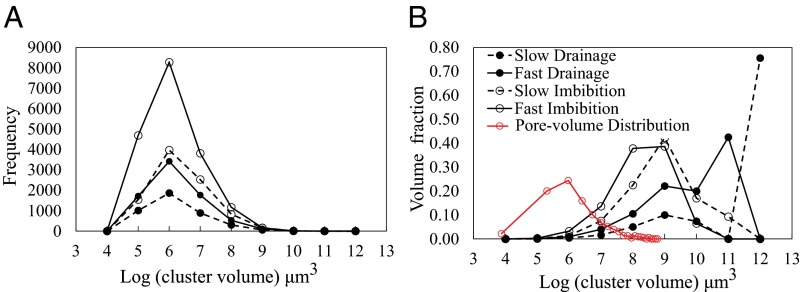
Fig. 2.
Number-based (A) and volume-based (B) cluster size distribution after the four injection steps shown in Fig. 1. Note the large oil clusters with volumes above 1010 μm3 that existed after the drainage steps. The red curve shows the pore size distribution of this rock extracted from the µCT image of the dry rock using a sphere fitting method (51). A continuous increase in number of clusters along with decrease in the cluster volumes indicates the change in oil structure during the drainage and imbibition processes.

