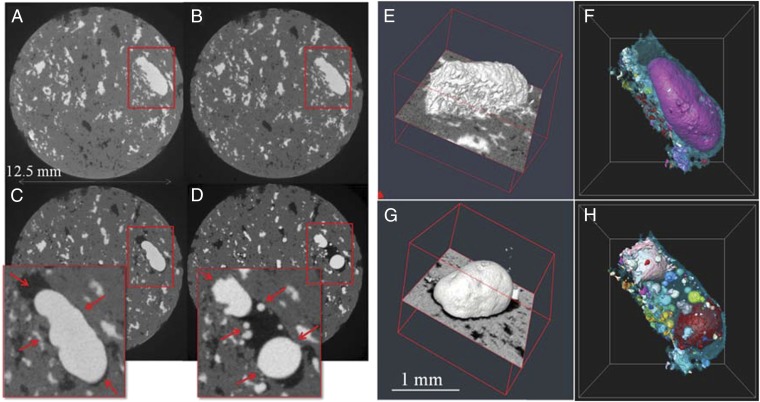
Fig. 3.
(A−D) Example µCT slices after the four injection steps shown in Fig. 1. (E and G) A 3D rendering of the oil phase in the area highlighted in B and C, respectively. (F and H) A 3D rendering from another view point of the oil phase highlighted in C and D, respectively. The discrete oil droplets are rendered in different colors, while the blue transparent surface shows the brine phase. The large isolated oil droplet shown in C, F, and G is trapped because of a snap-off event and cannot be produced from the pore in this capillary dominated regime (Nc = 1.95 × 10⁻⁷). Red arrows indicate a visible brine film surrounding the isolated droplet of oil after snap-off (C) and fragmented droplets after fast imbibition (D).

