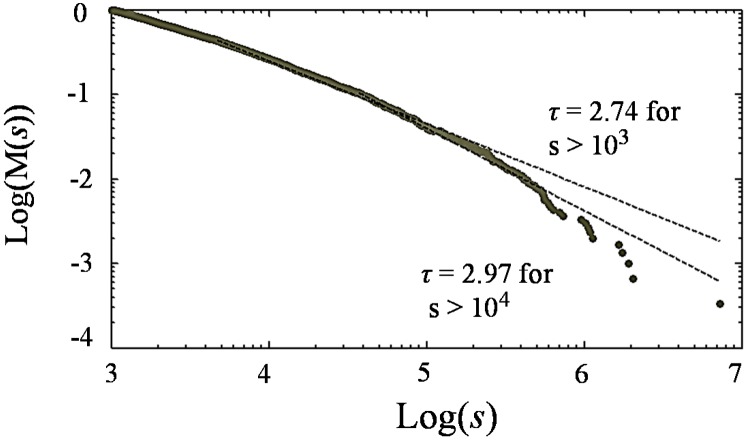
Fig. 6.
Cumulative cluster size probability distribution M(s) as a function of cluster size s, measured in voxels, calculated using a maximum likelihood estimator (52). It is possible to fit portions of the trapped oil “volume” distribution with a number of power-law functions such that τ ≥ 2. However, the entire range of the data does not fit a single power-law function.

