Fig. 2.
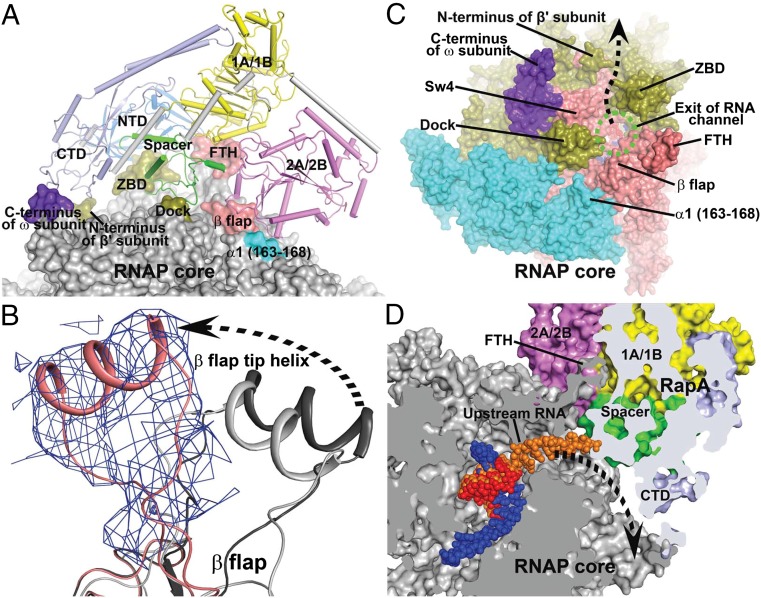
Interactions between RNAP core and RapA. (A) Overview of the interface between RNAP core (surface representation) and RapA (tube and arrows). The contact areas on the RNAP core are labeled and highlighted with colors. The RapA domains NTD, 1A/1B, 2A/2B, spacer, and CTD are shown in marine, yellow, violet, green, and pale blue, respectively. (B) Displacement of the β-flap tip helix in the RapA–RNAP core complex (salmon) relative to those in an RNAP holoenzyme (dark gray, PDB code 4JKR) (21) and an elongation complex (light gray, PDB code 2O5I) (16). Unbiased 2Fo-Fc density map (contoured at 1 σ) is shown as blue meshes for the FTH in the RapA–RNAP core complex. (C) Viewing down the RNA exit channel (green dashed oval) of RNAP. RapA is omitted for clarity. The RNAP core is shown in surface representation. Regions around the RNA exit channel are labeled. The dashed arrow marks the putative new RNA exit direction. (D) Clip view of the RNA exit channel. Both RNAP core and RapA are shown in surface representations. The RNAP core is colored in gray and RapA domains are colored as in A. RNA residues from a transcription elongation complex (16) are superimposed on the DNA–RNA hybrid and shown in orange for reference. A dashed arrow marks the potential RNA exit in the complex. FTH, β-flap tip helix; ZBD, β′ zinc-binding domain; SW4, RNAP switch 4; dock, β′ dock domain.

