Fig. 5.
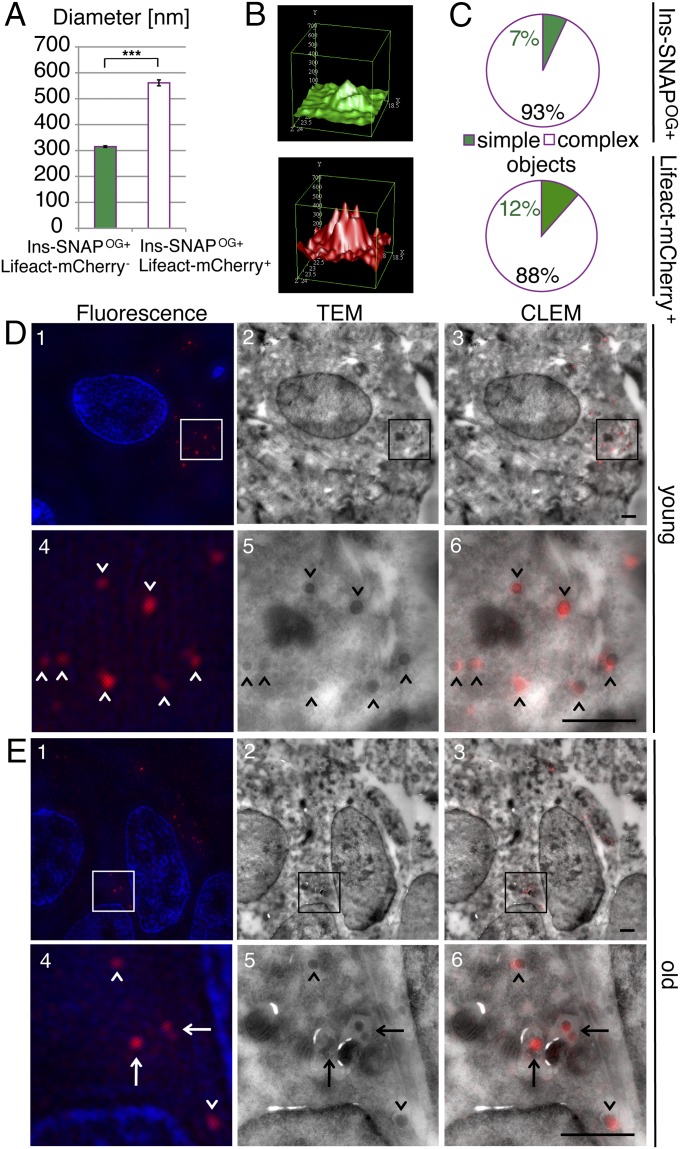
A fraction of old SGs is found in multigranular bodies. (A) Mean diameter of Ins-SNAPOG+, Lifeact-mCherry− SGs, and of Ins-SNAPOG+, Lifeact-mCherry+ SGs. Data are derived from the same dataset as in Fig. 4B. (B) Representative intensity profiles of a single complex Ins-SNAPOG+, Lifeact-mCherry+ object showing several overlapping fluorescence peaks in the green (Top) and red (Bottom) channels (possibility of bleed-through between channels was ruled out as described in Materials and Methods). (C) Frequency of the complex Ins-SNAPOG+, Lifeact-mCherry+ objects in the green (Top) and red (Bottom) channels as a result of counting 40 Ins-SNAPOG+ and 23 Lifeact-mCherry+ objects. (D) Representative images of young Ins-SNAPTMR-Star+ SGs visualized by (1) structured illumination microscopy (fluorescence). (2) TEM of the same region as in 1. (3) Overlay (CLEM) of images in 1 (red channel) and 2. (4–6) High magnification of the area boxed in 1–3. Arrowheads point to young Ins-SNAPTMR-Star+ SGs. (Scale bar, 1 µm.) (E) Representative images of old Ins-SNAPTMR-Star+ SGs visualized by (1) structured illumination microscopy (fluorescence). (2) TEM of the same region as in 1. (3) Overlay (CLEM) of images in 1 (red channel) and 2. (4–6) High magnification of the area boxed in 1–3. Arrowheads point to old Ins-SNAPTMR-Star+ SGs; arrows point to several old Ins-SNAPTMR-Star+ SGs within a MGB. In D and E, two independent CLEM experiments were performed counting in total in 19 cells 169 young Ins-SNAPTMR-Star+ SGs, out of which 16 were found in MGBs, and in 31 cells counting 197 Ins-SNAPTMR-Star+ SGs, out of which 76 were found in MGBs. (Scale bar, 1 µm.)

