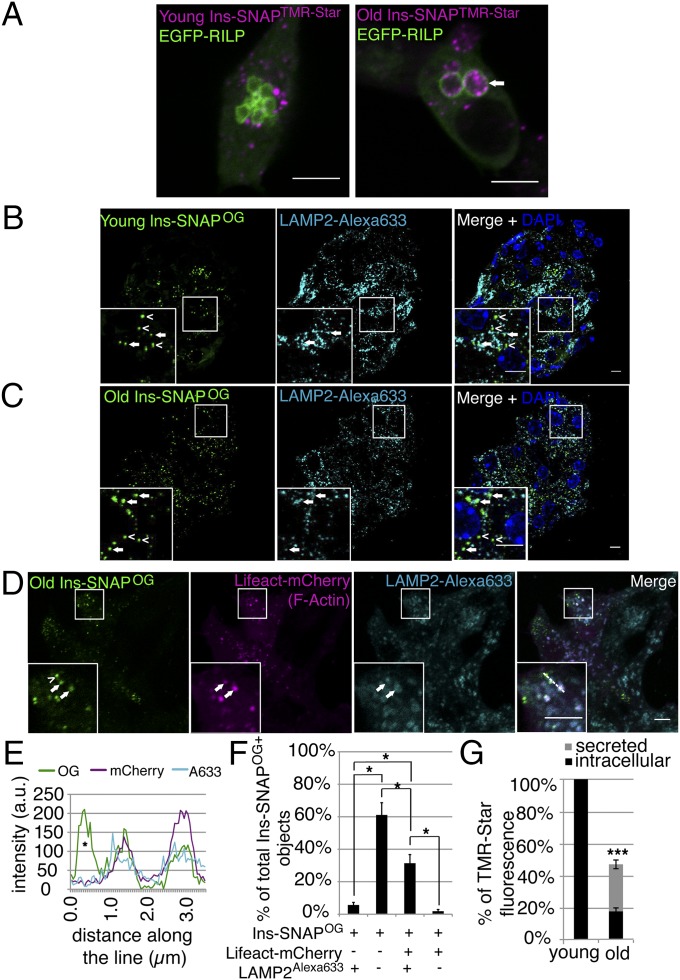
Fig. 6.
MGBs represent FA+ lysosomes involved in degradation of aged SGs. (A) Confocal images of EGFP-RILP and young or old Ins-SNAPTMR-Star+ objects in fixed INS-1 cells. An arrow points to old Ins-SNAPTMR-Star+ SGs within an EGFP-RILP+ compartment. Quantification was performed on the data obtained from three independent experiments. In total 23 cells containing 1,157 young Ins-SNAPTMR-Star+ SGs, out of which 170 were EGFP-RILP+ and 19 cells containing 684 old Ins-SNAPTMR-Star+ SGs, out of which 196 were EGFP-RILP+. (Scale bars, 5 µm.) (B) Confocal images of young Ins-SNAPOG+ SGs (open arrowheads) and LAMP2+ lysosomes (filled arrowhead) in beta cells of SOFIA mice. (Scale bar, 5 µm.) (C) Confocal images of old Ins-SNAPOG+ SGs (empty arrowheads) and LAMP2+ lysosomes (full arrowhead) in beta cells of SOFIA mice. In B and C, two independent islet isolations were performed from two SOFIA mice each time. In total was counted 100 cells with 1,975 young Ins-SNAPOG+ SGs, out of which 240 were LAMP2+ and 218 cells with 1,615 old Ins-SNAPOG+ SGs, out of which 335 were LAMP2+. (Scale bar, 5 µm.) (D) Colocalization of old Ins-SNAPOG+, Lifeact-mCherry+ (arrow) SGs with LAMP2 in INS-1 cells. Ins-SNAPOG+, Lifeact-mCherry− SG (arrowhead) does not colocalize with LAMP2. Quantification (shown in F) was performed on the data obtained from threee independent experiments counting in total 44 old Ins-SNAPOG+/LAMP2+/Lifeact-mCherry− SGs, 458 old Ins-SNAPOG+/LAMP2−/Lifeact-mCherry− SGs, 244 old Ins-SNAPOG+/LAMP2+/Lifeact-mCherry+ SGs, and 14 old Ins-SNAPOG+/LAMP2−/Lifeact-mCherry+ SGs. (Scale bar, 5 µm.) (E) Fluorescence intensity profile across the line for OG, mCherry, and Alexa633. An asterisk marks the intensity profile of the SG indicated in B by the arrowhead. (F) Percentage of LAMP2+ and/or Lifeact-mCherry+ old Ins-SNAPOG+ SGs in INS-1 cells. (G) Fluorimetric analysis of Ins-SNAPTMR-Star turnover. Fluorescence of 28- to 30-h-old Ins-SNAPTMR-Star in the cells and in media compared with the 3- to 5-h-old Ins-SNAPTMR-Star in the cells. The difference between 3- to 5-h-old Ins-SNAPTMR-Star in the cells and 28- to 30-h-old Ins-SNAPTMR-Star in the cells plus in media equals the amount of degraded Ins-SNAPTMR-Star. Data were obtained from three independent fluorimetric experiments, each containing biological triplicate for young and old Ins-SNAPTMR-Star and measured in loading triplicates. For all measurements the same number of cells was seeded. To confirm that the loss of Ins-SNAPTMR-Star signal is not due to the loss of the cells over the time course we measured total protein concentration in the samples. The total protein concentration increased over time (from 0.271 µg/mL to 0.357 µg/mL), which reflects the increase in the cell number during incubation time. Because we measured the signal of Ins-SNAPTMR-Star signal originating from the labeling at the same starting point, increase in the cell number in the culture in the absence of TMR-Star substrate could not affect the fluorimetric analysis.

