
Figure 2. Adipose iNKT cells lack PLZF and are present in PLZF−/− mice.
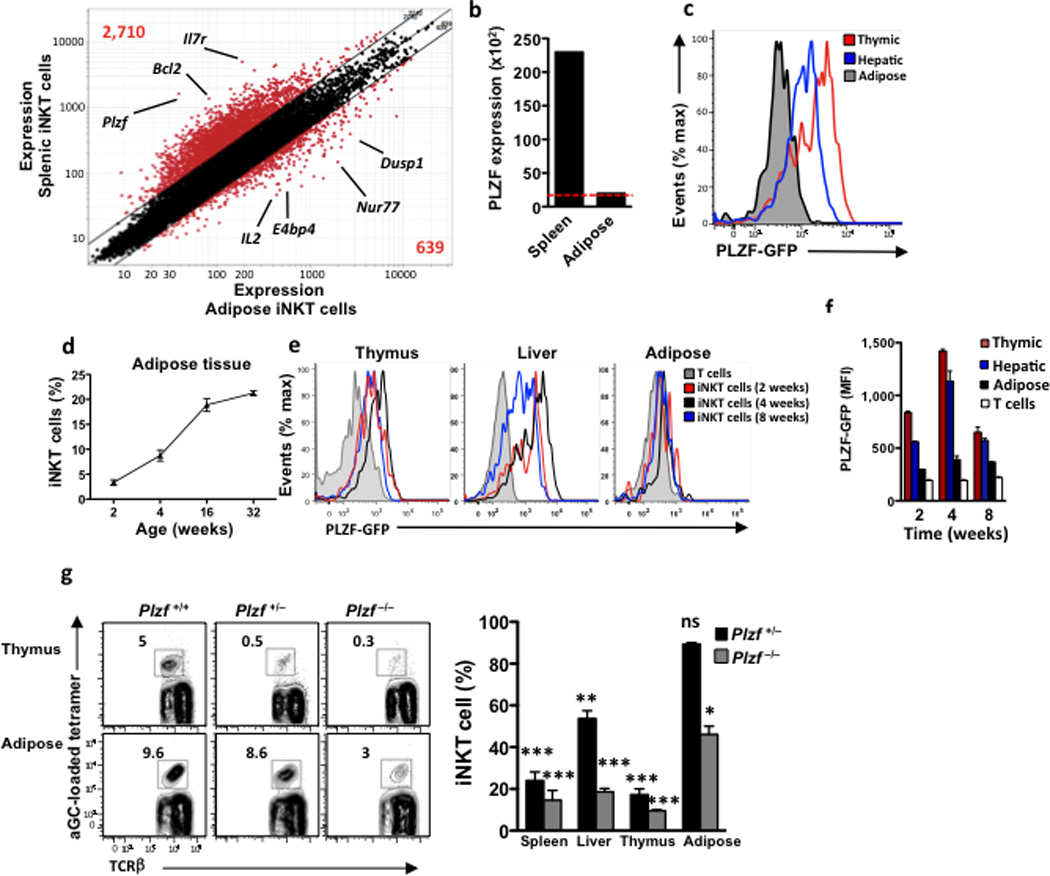
(a) Microarray analysis. Normalized expression values for transcripts isolated from iNKT cells from epididymal fat versus spleen of 6-week-old B6 males. (b) PLZF expression levels of iNKT cells from matched spleen and adipose tissue. Red dotted line represents the expression cut-off level. (c) PLZF-GFP mice were used to measure PLZF expression by flow cytometry. iNKT cells were gated in each organ and GFP+ cells were measured. Histogram illustrates matched organs from one mouse, data is representative of 9 mice. (d) Levels of iNKT cells in adipose tissue with age, as a % of total adipose T cells. n=4 mice per age group. (e) GFP+ cells gated on iNKT cells in thymus, liver and adipose, from PLZF-GFP mice age 2, 4 and 8 weeks old. Histograms represent 4 mice per age group. (f) PLZF MFI expression on thymic, hepatic and adipose iNKT cells compared to adipose (non-iNKT) T cells (white) Each timepoint = n=4 mice. (g) Representative contour plots of iNKT cell levels in thymus and adipose in PLZF+/+, PLZF+/− and PLZF−/− littermates. Right: Graph of reduced iNKT cell levels in PLZF+/− (n=7) and PLZF−/− (n=4) compared to WT mice (n=5). * represents statistical significance compared to WT littermate mice. Statistical comparisons using ANOVA and Tukey post-hoc test. *p<0.05, **p=<0.01, ***p<0.001.