
Figure 4. Adipose iNKT cells express E4BP4 which induces IL-10 production.
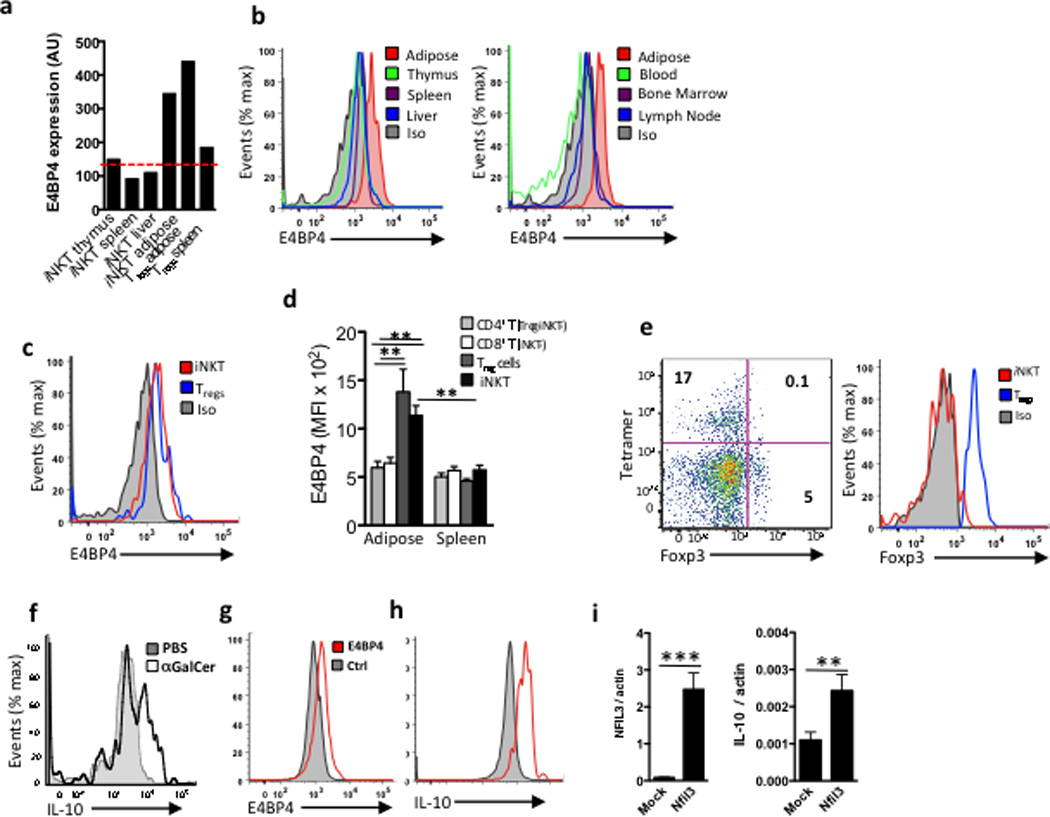
(a) mRNA levels of E4BP4 (Nfil3) in iNKT cells from thymus, spleen, liver and adipose tissue, as wells as Tregs from adipose and spleen as comparison. (b) Representative histogram of intracellular staining for E4BP4 in iNKT cells in several organs and adipose (red), and isotype control (grey filled) (n=4 mice, same mice for each organ). (c) Representative histogram comparing intracellular staining of E4BP4 in adipose iNKT cells vs. adipose Tregs cells (B&C) representative of n=6. (d) Graph of E4BP4 expression (MFI) by flow cytometry gated on adipose and splenic CD4+ and CD8+ T cells after Tregs and iNKT cells were excluded, compared to adipose and splenic Tregs and iNKT cells (n=5). (e) Representative dot plot of Foxp3 staining and tetramer staining after gating on adipose TCRβ+ cells, and histogram of Foxp3 levels in iNKT cells and Tregs cells from adipose tissue (representative of n=8). (f) Intracellular staining of IL-10 in adipose iNKT cells after 4hrs stimulation in vivo following PBS or αGalCer injection, representative of n=6 mice. (g) Primary splenic iNKT cell lines were transfected with E4BP4 (red lines) or mock transfected (grey). Representative histogram of E4BP4 expression 18 hrs after transfection. (h) Intracellular levels of IL-10 levels and (i) mRNA levels of IL-10 in iNKT cells transfected with E4BP4 or mock transfected (n=3 cell lines transfected and mock transfected).