
Figure 5. Adipose iNKT cells interact with macrophages in vivo and induce M2 macrophages through IL-10.
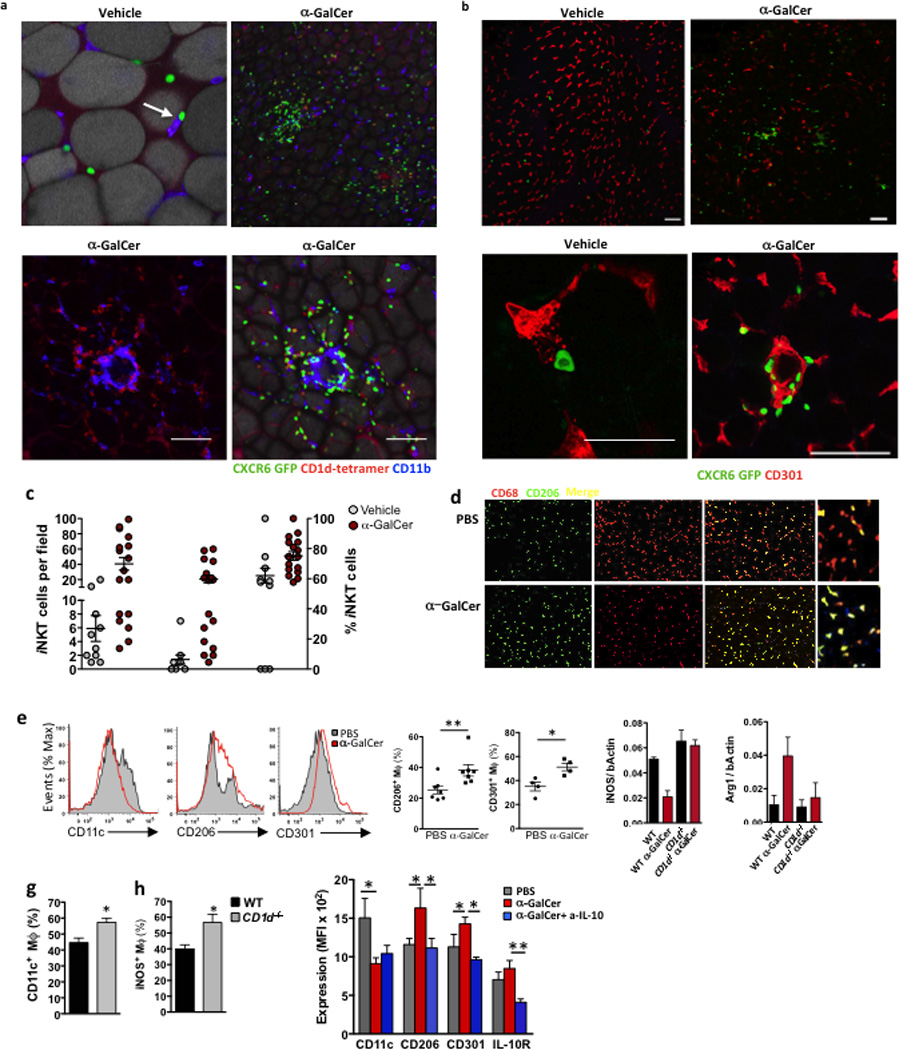
(a&b) Confocal images of CD1d tetramer labeling and CXCR6-GFP+ cells, co-stained with CD11b or CD4, in whole adipose tissue sections from WT and CXCR6-GFP+ mice 4 days after treatment with vehicle control or αGalCer (representative of 5 mice per treatment). (c) Quantification of iNKT-macrophage interactions. Number of iNKT cells after vehicle or αGalCer treatment per field (Left group), number of iNKT cells co-localizing with macrophages (middle group), and quantification of % of total iNKT cells interacting with macrophages per field after vehicle or αGalCer treatment (right group). (d) Immunofluorescent microscopy staining for macrophages in whole mount adipose tissue 3 days after in vivo PBS or αGalCer treatment. CD68 (red), CD206/MMR (green) and double positive ‘M2 phenotype’ macrophages (merged yellow cells). (e) Representative histograms of CD11c, CD206 and CD301 levels after gating on CD11b+F480+ macrophages in adipose tissue. Graphs of CD206+ (n=7) and CD301+ F480+ (n=4) macrophages in each mouse after treatment in vivo with PBS or αGalCer. (f) qPCR of iNOS and Arginine (Arg1) levels over bActin in whole adipose tissue after vehicle or αGalCer treatment in WT and CD1d−/− mice (n=3 per group). (g) Surface CD11c+ and (h) intracellular levels of iNOS in adipose macrophages in WT and CD1d−/− mice (n=3 per group). (i) In vivo treatment of WT mice with PBS or αGalCer (aGC) was repeated, with the inclusion of an IL-10 neutralizing antibody (aIL-10). Graph of mean level of CD11c, CD206, CD301 and IL-10R on adipose macrophages (n=4–5). Statistical comparisons using t-tests or ANOVA for group of 3 with Tukey post-hoc test. *p<0.05, **p=<0.01, ***p<0.001.