
Figure 6. Adipose iNKT control adipose tissue Tregs through IL-2 production.
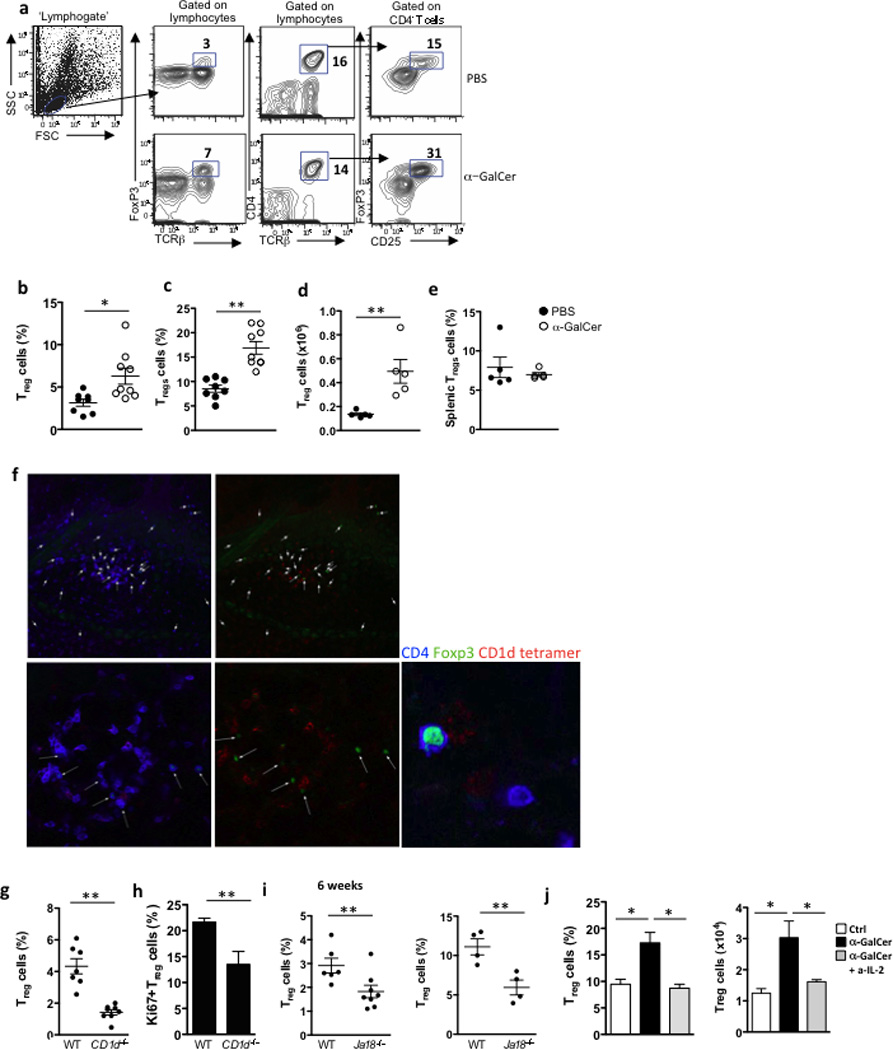
(a) Gating strategy, and representative contour plots of adipose Tregs after PBS or αGalCer treatment. (b) Levels of Tregs as a % of adipose lymphocytes and (c) as % of adipose T cells, after treatment with PBS (n=8) or αGalCer (n=9). and (d) number of Tregs in adipose tissue after treatment with PBS or αGalCer (n=5). (e) Levels of splenic Tregs from the same mice after treatment with PBS or αGalCer (n=5). Treg cell levels and numbers were measured 3 days post-injection. (f) Confocal images of CD1d tetramer labeling and Foxp3-GFP+ cells, co-stained with CD4, in whole adipose tissue sections from Foxp3-GFP+ mice that received αGalCer (represents 4 mice). (g) Levels of Tregs as a % of adipose lymphocytes, in 6wk-old WT versus CD1d−/− mice (n=7 per strain). (h) Adipose Tregs were stained intracellularly with Ki67 in 6wk-old WT versus CD1d−/− mice (n=5). (i) Levels of Tregs as a % of adipose T cells, in 6wk-old and 6 month old WT (n=6 and n=4) versus Ja18−/− mice (n=9 and n=4). (j) Treatment of WT mice with PBS or αGalCer (n=5 per group) was repeated, with the inclusion of an IL-2 neutralizing antibody in one group of αGalCer treated mice, and Treg % and number were measured in adipose tissue. Statistical comparisons using t-tests or ANOVA for group of 3 with Tukey post-hoc test. *p<0.05, **p=<0.01, ***p<0.001.