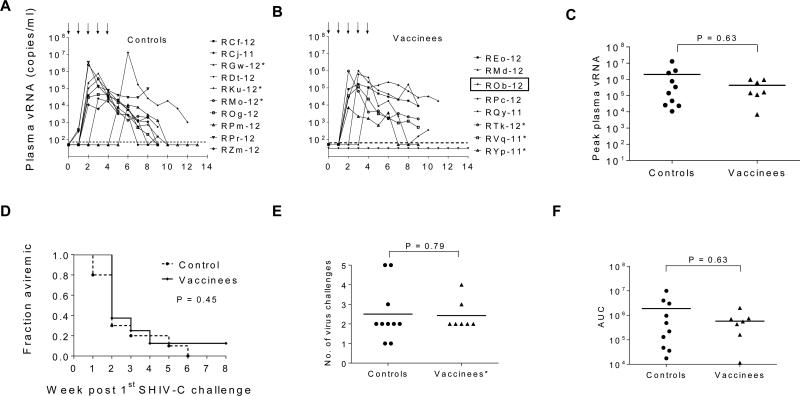
Fig. 4.
Post challenge viremia data. (A–B) Five low-dose i.r. challenges of SHIV-2873Nip were given at weeks 0, 1, 2, 3, & 4 (as shown by black arrows) and plasma vRNA levels were measured. (C) Comparison of peak plasma vRNA levels, (D) Kaplan–Meier plots depicting the fraction of RMs remaining aviremic, (E) comparison of the number of virus challenges before detection of viremia, and (F) comparison of area-under-the-curve (AUC) for viremic RMs. RM ROb-12 (boxed) remained aviremic after all heterologous SHIV-C challenges. Horizontal dashed line in A-B, the lower limit of plasma vRNA detection (50 vRNA copies/ml); horizontal solid lines in C, E, & F, mean peak plasma vRNA, the mean number of virus challenges before detection of viremia, & mean AUC, respectively. *, Mamu A*001+ RMs.

