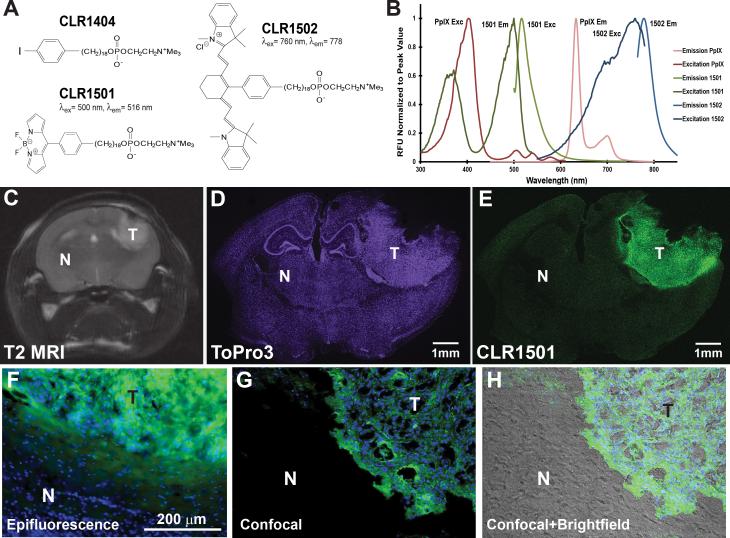
Figure 1.
(A) Chemical structures of APC analogs. (B) Fluorescence spectra: CLR1501 (excitation peak 500nm, emission peak 517nm). CLR1502 (excitation peak 760nm, emission peak 778nm). PpIX (excitation peak 402nm, emission peak 633nm). (C-E) U251-derived orthotopic brain tumor verified by MRI (C, T2-weighted) and labeled with CLR1501 (E), with ToPro3 nuclear counterstain (D). (F-H) Histological analysis of brain-tumor interface in 22T GBM-derived orthotopic xenograft labeled with CLR1501 (green) (F) epifluorescence visualization of xenograft-brain border with blue DAPI nuclear counterstain. (G) Confocal view of xenograft labeled with CLR1501. (H) Confocal and brightfield view of xenograft and adjacent normal brain. T: tumor, N: normal brain.

