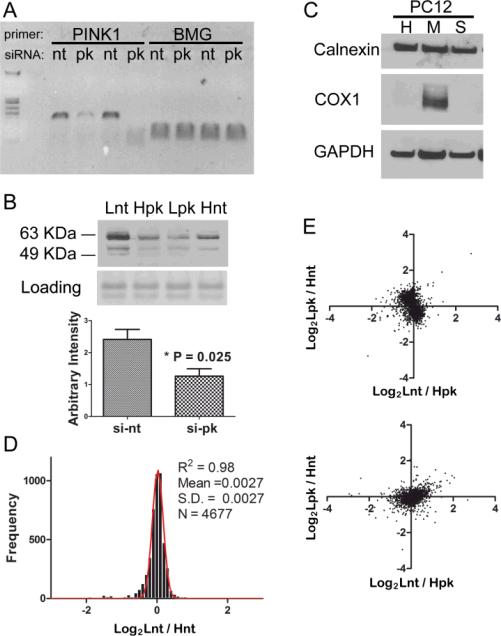
Fig. 2.
The proteome was not altered after knocking down PINK1. (a) RT-PCR shows effective knocking down of PINK1 mRNA (pk) comparing to non-target control (nt), with β2-microglobulin (BMG) mRNA serving as a loading control. The specific amplicon of 116 bp is shown in the gel.(b) Western blot analysis shows that endogenous PINK1 protein is greatly reduced after introducing siRNA against PINK1. Both full length and processed PINK1 at an apparent molecular weight between 50-64 KDa are detected. Lnt: light-isotope labeled cells were treated with non-target siRNA, Hpk: heavy-isotope labeled cells were treated with PINK1 siRNA, Lpk and Hnt represent the labeling strategy in the swapped experiment. (c) Western blot analysis shows the enrichment of mitochondrial (M) components compared with whole cell homogenate (H) and soluble cell fraction (S). (d) The same batch of PC12 cells were grown in either light or heavy SILAC media, equal amount of total cellular protein were mixed and analyzed by the MudPIT procedure and thousands of proteins were quantified. The distributions of protein ratios between light and heavy cells follow normal distribution with very small deviation. (e) Two biological experiments with swap labeling show light versus heavy protein ratios representing PC12 cells transfected with either PINK1 siRNA or control siRNA . Both the cytosolic fraction (upper panel) and the mitochondria fraction (lower panel) were plotted.

