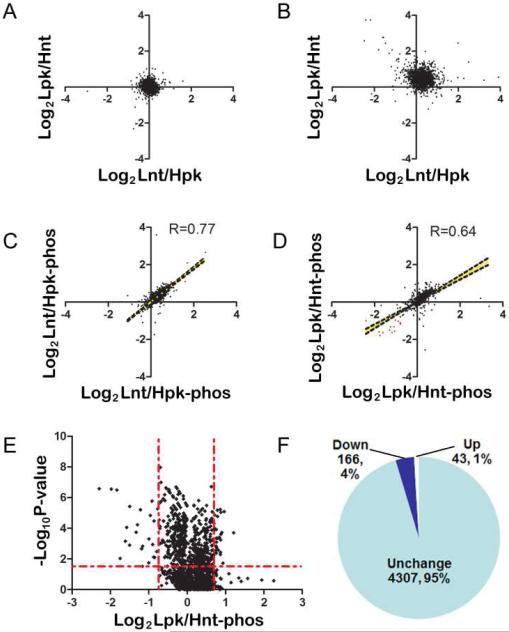
Fig. 3.
Identification of phosphoproteome changes after knocking down PINK1. (a) and (b) Similar to Figure 2e except that HEK293 cells were used in the experiment. (c) and (d) Quantification of phosphopeptide from two instrument runs of two biological experiments shows good correlation. The representation for the experiment scheme was the same as used in Figure 2. (e) Volcano plot of the phosphopeptide ratios shows a trend of reduced phosphorylation after knocking down PINK1. (f) Schematic representation of the quantitative phosphorylation results.

