Figure 2.

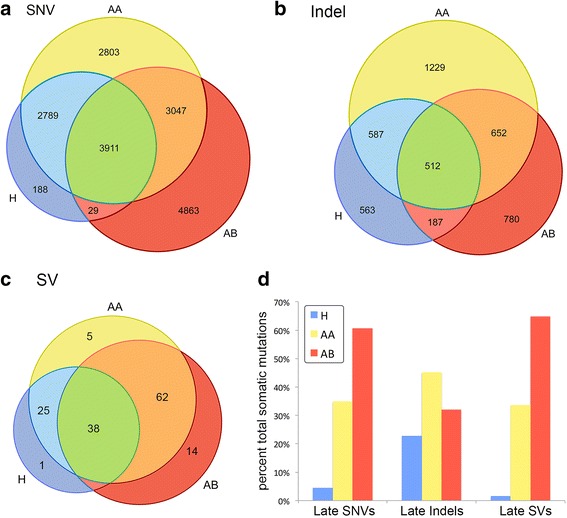
Venn diagrams of shared and unique somatic mutations. Venn diagrams were constructed from different classes of somatic mutations by comparing the three tumor subpopulations (H, AA, and AB). (a) Single nucleotide variants, (b) small insertions and deletions, (c) structural variants, and (d) barchart of the somatic mutation percentages in each tumor subpopulation.
