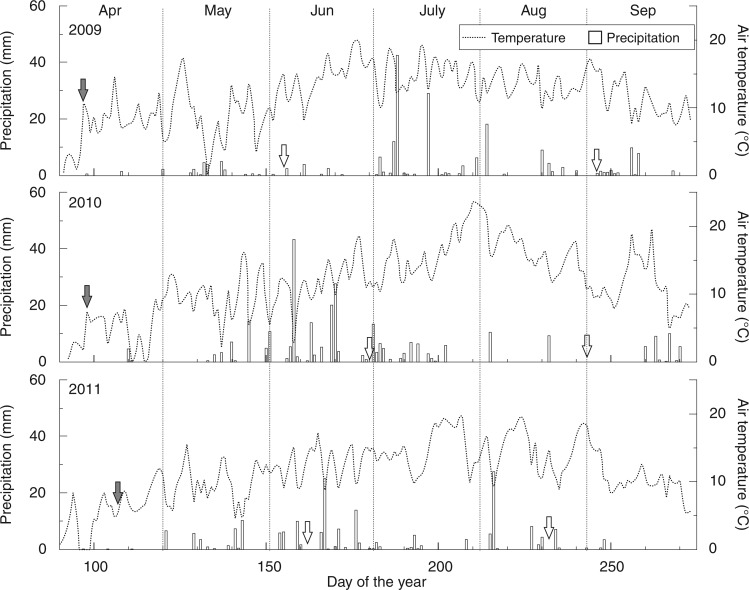
Fig. 5.
Daily precipitation sum (bars) and mean air temperature (dotted lines) from April through September during 2009–2011. Filled arrows indicate the date (twarming), i.e. the fifth day, when daily mean temperature warmer than 5 °C was recorded for five consecutive days. Open arrows indicate the onset and the end of xylem differentiation.

