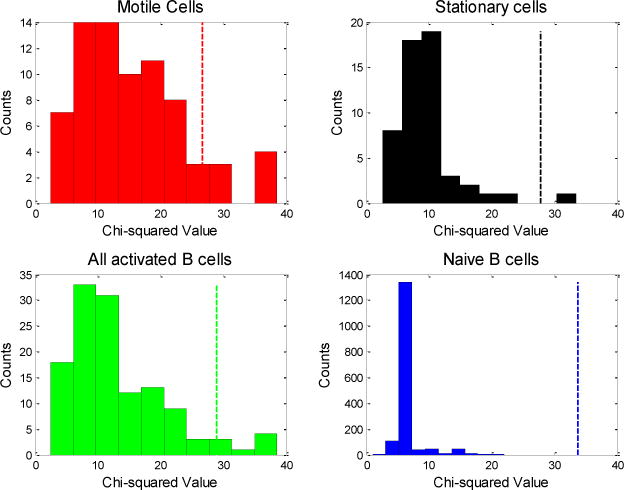
Figure 3.

Histograms of chi-squared values for all four experiments combined: Each chi-squared value results from incremental displacement analysis of a single cell track. The dotted vertical lines indicate p-value cutoffs of 0.0004 for the motile cells, 0.0002 for stationary cells, 0.0001 for all activated B cells, and 0.00002 for naïve B cells. These are the Bonferroni corrected cutoffs corresponding to a Type I error of 0.05.
